Column and Panel Buckling
Buckling is a physical occurrence observed in slender structures, such as columns, beams, rods or panel; when it undergoes bending due to applied loads, leading to eventual buckling. This phenomenon can result in the complete failure of the structure. Buckling occurs when the applied load surpasses the structure’s buckling load, which represents the maximum load the structure can bear before undergoing buckling. The buckling load is influenced by factors like the geometry and material composition of the structure.
Why is buckling important in engineering
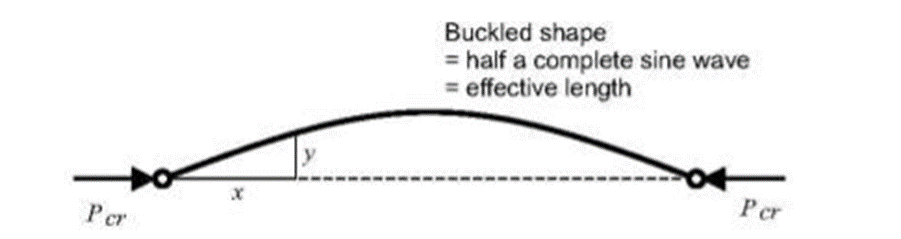
Buckling is the sudden change in the shape of a part like a rod/column or structural member. A bar or column can be subject to a buckling failure mode when an axial load is applied to it in compression. The behavior of a column can be predicted based on the end condition of the column such as the bowing (sinusoidal deformation) of a column under compression.
Euler’s Buckling Formula
Euler’s Buckling Formula, a cornerstone in structural engineering, addresses the critical buckling load of slender structural member under compressive loads. Developed by Swiss mathematician Leonhard Euler in the 18th century, the formula mathematically characterizes the stability limits of a structural member based on its length, material properties, and end conditions. Expressing the critical buckling load as a function of these factors, Euler’s formula provides valuable insights into the potential for structural instability. Engineers widely apply it to design resilient structures, ensuring columns can withstand compressive forces without succumbing to buckling, thereby enhancing the stability and safety of various architectural and engineering applications.
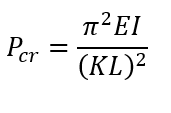
Euler’s Buckling Formula provides an analytical expression for the critical buckling load (Pcritical) of an idealized slender column under an axial compressive load. The formula is given by:

where:
- E is the modulus of elasticity of the material,
- I is the column’s moment of inertia,
- L is the effective length of the column,
- K is the column effective length factor (dependent on the end conditions).
Euler’s Buckling Formula helps engineers assess the stability of columns and design structures to prevent buckling under compressive loads.
How does the moment of Inertia affect buckling?
Moment of inertia is dependent on the mass distribution of the body, the larger the moment of inertia the greater the required torque to change the body’s rate of rotation. As a result, the column is always going to buckle about the minimum axis of the moment of inertia.
What factors affect buckling?
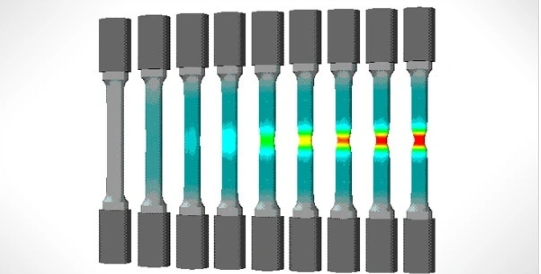
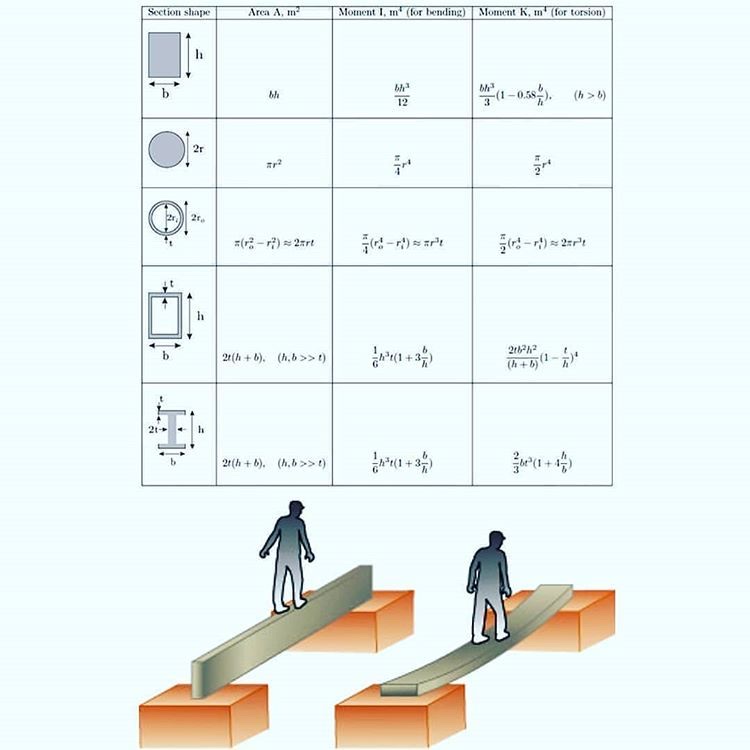
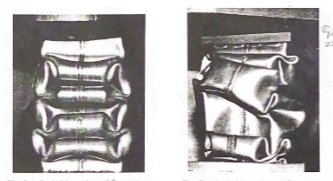
There are various factors that will affect how and when a column will buckle. Some of the most important factors are the slender ratio, loading, and boundary conditions of a column. However, it is also important to remember that material and geometry (cross-section type) also play an important role in how a part will bucket. The pictures below show the buckling behavior of two identical box columns. The picture on the left is the box column where the critical stress was greater than the yield stress of the material. As a result, the mode of failure was governed by the material. The picture on the right had a yield stress greater than the critical stress of the material. As a result, the failure was governed by the geometry of the box column.
What is slenderness ratio?
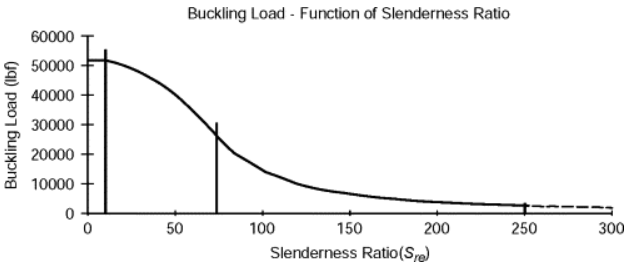
The slenderness ratio in structural engineering is a crucial parameter that assesses the slender nature of a column or structural member. It is defined as the ratio of the effective length (L) of the member to its radius of gyration (r), representing how slender or squat the member is relative to its ability to resist buckling. Mathematically expressed as (Slenderness Ratio = L/r), this ratio is instrumental in determining the critical buckling load and assessing the stability of the structure under compressive loads. A higher slenderness ratio indicates greater susceptibility to buckling, when the slenderness ratio exceeds a value of 100 for a strong slim column, failure by buckling can be expected. Columns of stiffer and more brittle materials will buckle at lower slenderness ratios.
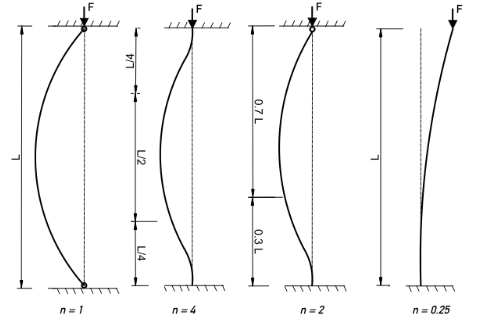
Effective length and end conditions in engineering buckling
Effective length and end conditions play pivotal roles in the engineering analysis of buckling, influencing the stability of structural elements like columns. The effective length (L) represents the hypothetical length of a column that would buckle under the same conditions as the real column. The effective length is multiplied by the actual length of the column to obtain a value that represents the column’s behavior with respect to buckling.
Effect lenth takes into consideration the end conditions, which dictate how a column is restrained at its ends. Common end conditions include pinned ends and fixed ends, each influencing the column’s behavior. Engineers use effective length and end conditions to calculate the critical buckling load, guiding the design process to enhance structural stability and prevent premature failure under compressive loads.
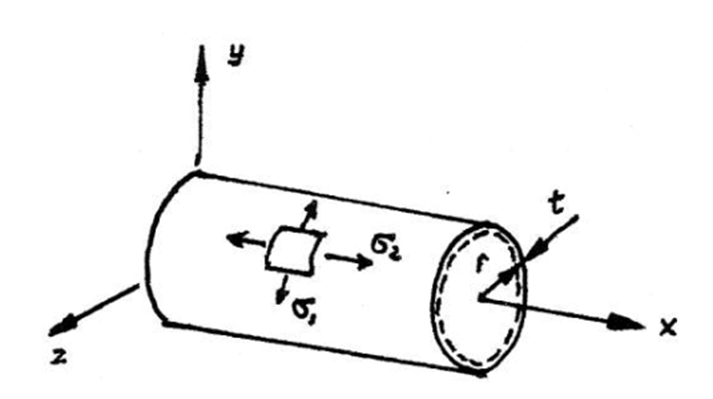
What is panel buckling?
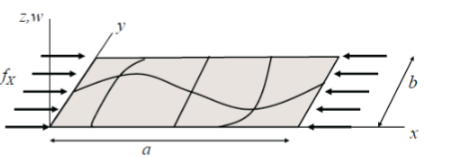
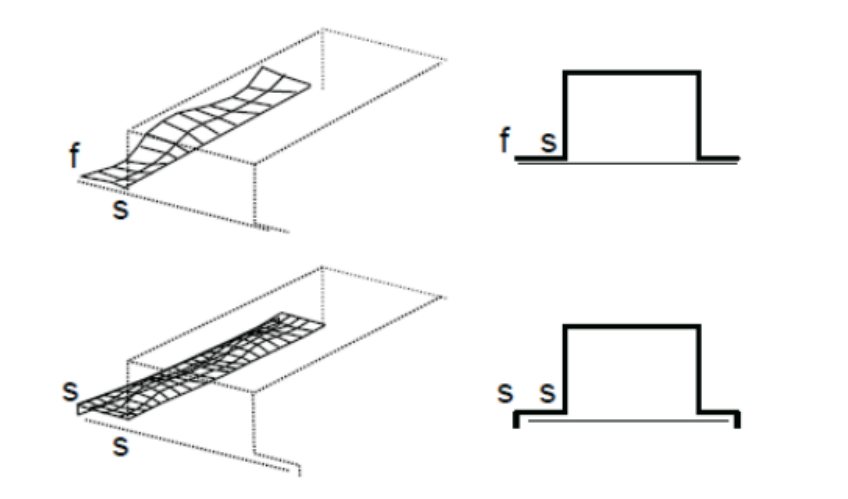
Plates are initially flat structural elements, with a very small thickness compared with the remaining dimensions. The buckling of a panel or plate is often referred to as wrinkling and it is the result of the shear stress which is caused by compression load. The buckling behavior of panels is very different when compared to the behavior of columns.
Is buckling a sudden failure?
For the vast majority of cases when a structural element experiences buckling, it is a sure sign of part failure. However, it is very important to remember that the post-buckling behavior of a plate varies significantly when compared to a beam or column.
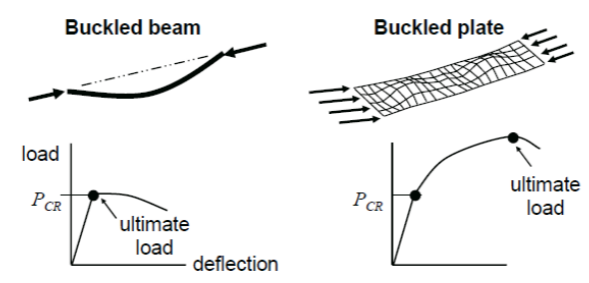
For example, once a structural beam experiences buckling, the beam will lose its ability to carry loads. This can be seen in the graph on the left where after the critical load (Pcr) is reached the load starts to drop off. However, the behavior of a plate is not the same. Even after a plate buckles it will still be able to carry an increased load.
Tools for Determining Buckling Loads
Various tools are accessible for determining the critical buckling load, including hand calculation /spreadsheets, tables, and Finite Element Analysis (FEA) software. Spreadsheets offer simplicity but lack customization, making them less adaptable to unique projects. Tables, like those in the back of many college textbooks, are cost-effective and widely used for calculating effective lengths that modify critical load calculations. Finite Element Analysis software, exemplified by Solidworks, Abaqus, or Altair HyperWorks proves beneficial for complex geometries or systems with irregularities. Unlike Euler’s calculation, it efficiently addresses variations in stiffness along a beam’s length due to changing cross-sections. Users can create spreadsheets, obtain tables from references, and utilize FEA software for accurate and efficient buckling load analyses.
How to Prevent Buckling?
Preventing buckling necessitates a comprehensive grasp of the structure’s buckling behavior, and one approach is to perform buckling analysis. This analysis entails determining the critical buckling load, which is the load necessary for the structure to undergo buckling. Various methods, including analytical, numerical, and experimental approaches, can be employed for buckling analysis, with the selection dependent on the problem’s complexity and the desired accuracy. Another strategy to avert buckling involves designing the structure with a buckling safety factor. This safety factor is applied to the buckling load to guarantee the structure’s ability to withstand the load without succumbing to buckling.
Design Changes to Prevent Buckling
There are various design changes which can be implmented to prevent buckling from occurring. For starters looking at changing the crossectional area or slender ratio of a part which will help reduce the likelihood of bucking. Changing material will also help reduce buckling but only if critical stress was greater than the yield stress. If you are dealing with a plate/panel as shown below you can try adding stiffening beads to reduce the length of b.
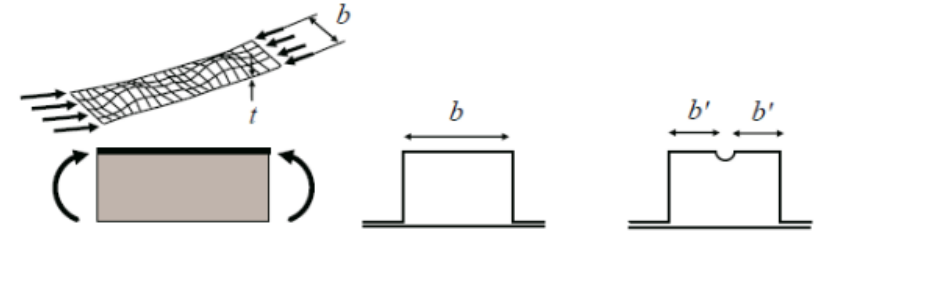
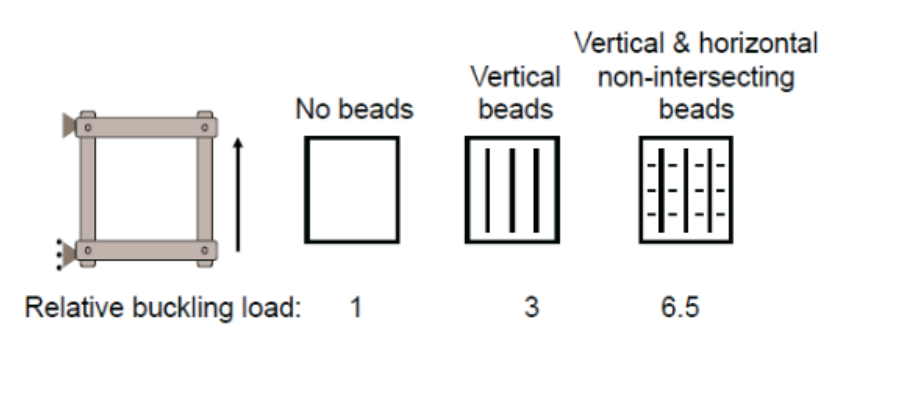
As seen below by adding a fore-aft stiffening bead to a large panel you can triple the buckling load. And if you had vertical and horizontal stiffening beads which are non-intersecting you can increase the buckling load by 6.5 times. The reason why stiffening beads are able to improve buckling is because of all the added form being introduced into the panel.
What is a flange in sheet metal?
A flange is a feature commonly added to sheet metal parts that consist of bending the ends of the part at 90 degrees. Curl flanges are a great way of adding strength to a plate which also helps reduce buckling in sheet metal parts.
How the buckling test is done?
Materials:
- Standard set of different materials and cross-section struts.
- VDAS Hardware and Software
- Load Meter
- Load Meter end
- Knife-edge support
- Loading end with hand wheel
- Loading measuring end
- Deflection Indicator
- Calipers
Procedures:
- To begin this experiment first find the 600mm steel strut and measure the width and thickness of the beam.
- Connect the switch on the load display, tap the load measuring end to remove any effects of friction, and zero out the screen.
- Turn the hand wheel to give a small gap behind the chuck.
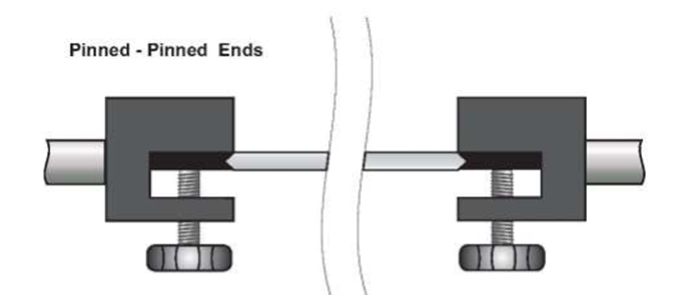
- Using the Alan key wrench loosen up the screws on the loading end and adjust it until the strut fits into each chuck with the pinned-pinned support. See figure 1: Pinned – Pinned supports
5. Move the deflection indicator to the midway point of the strut, and then zero out the deflection indicator.
6. Create a results table in the VDAS software.
7. Start to turn the hand wheel to apply a small force on the strut(less than 5N) just to ensure that the pinned ends are secure. Make sure that the beam bends away from the deflection indicator.
8. Make sure the ends of the strut are secure and the pinned end is not loose.
9. Zero the deflection indicator.
10. Move the indicator along the strut starting from the left end of the beam moving towards the right in steps of 25mm, at each step take and record data values on the software.
11. Move the deflection indicator back to the halfway point, and load the strut until the central deflection is about 6mm.
12. Repeat step 10 on the loaded beam.
13. For the second part of the experiment connect and switch on the load display. Tap the load measuring end to remove any effects of friction and zero the display.
14. Grab the 750 mm steel strut and using the calipers measure the base and height.
15. Fit the strut in the pinned-pinned end condition as above.
16. Remove the deflection indicator.
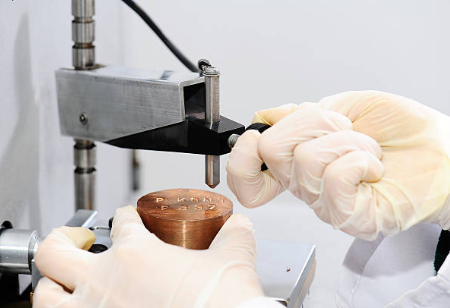
17. Use the large hand wheel to load the strut slowly until the strut buckles. As the load is being added gently press at the center and when the strut is pushed and stays in the position then you have reached the buckling point. See Figure 2: Loading of Strut.
18. Repeat steps 13-17 for the strut of lengths 650 mm and 600mm. record all data.
19. For the final part of this experiment find the 625mm steel strut (number 4) and measure its dimension ( base and height) using the calipers.
20. Repeat step 17 from the previous part of this experiment but instead of changing the length of the beam change the end conditions of the strut from pinned-pinned to pinned-fixed and fixed-fixed. Record all data. See Figure 3: End Conditions at the top of the following page.

Equations/Givens:
Theory:
The theory behind this experiment is to find out at what load steel will buckle by changing the end condition and the length of the strut.
Equations:
Area:

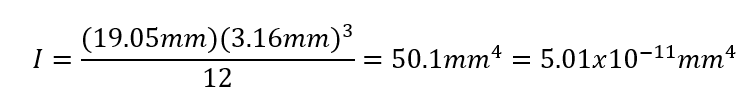
Moment of inertia:

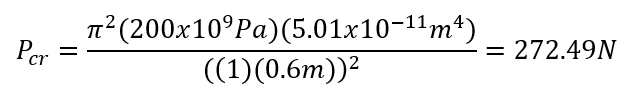
Maximum axial buckling load:
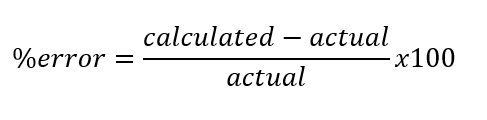
% error:
Published data charts:

Example calculations:
Area:

Moment of Interia:
Maximum axial buckling load:


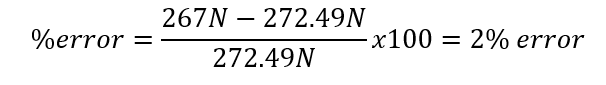
% error:
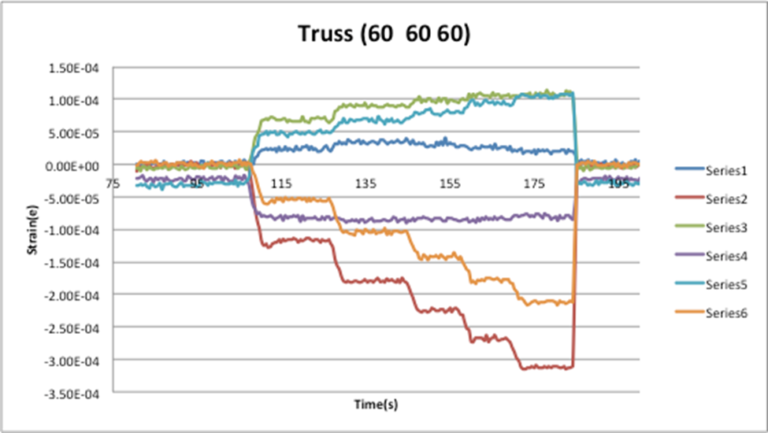
Graphs:
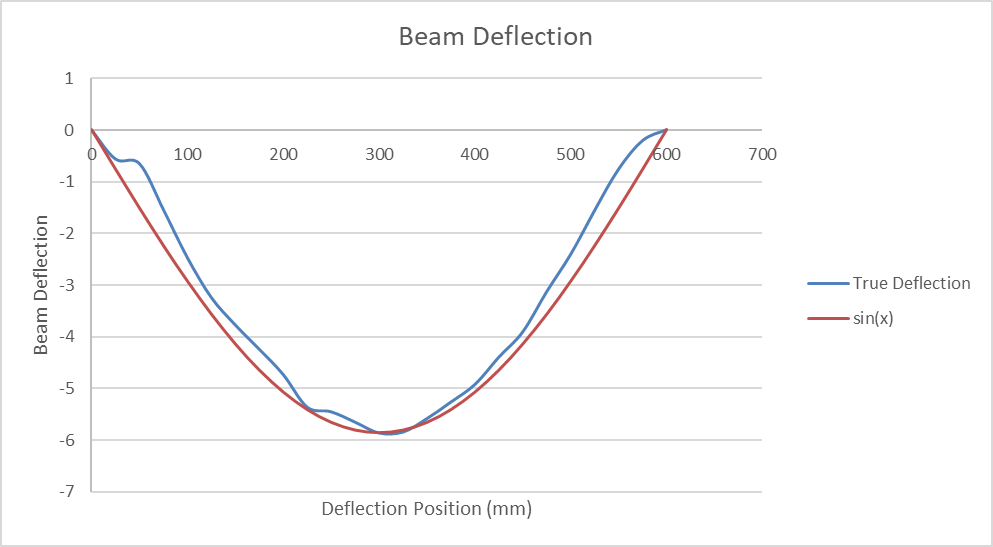
Function approximation – f(x) = -5.86sin((2πx)/1200)
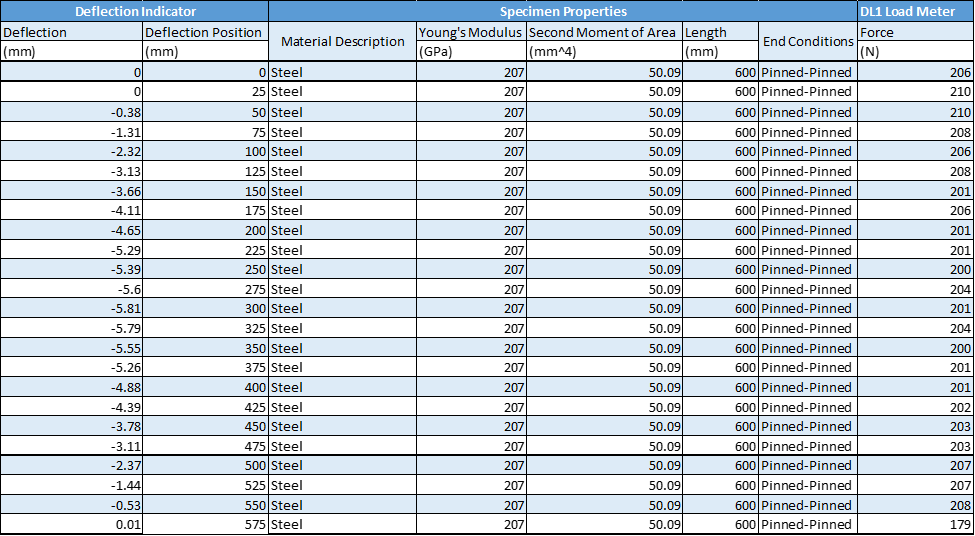
Data sets:

Findings:
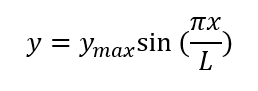
After conducting this experiment and evaluating the experimental data I am very pleased with the way everything turned out. For the first part of the experiment, a force was applied to a beam until the beam had a total deflection of 6mm at the center. The deflections at every 25mm were taken and that data was plotted against a theoretical sine wave function representing the deflection. Based on that I believe that that data came out nicely. The function that was used to represent this data theoretically was, f(x) = -5.86*sin((2πx)/1200). This equation came from the know equation for a sine wave f(x) = Asin((2πx)/λ) where A is the amplitude of the function in this our experiment the max deflection recorded was 5.86 mm and where λ represents the period of the function. Because we plotted half a sine wave function with a total distance of 600mm then the total period of the function had to be twice the distance recorded or 1200mm. unfortunately, because excel does not have the capacity to compare trigonometric functions for the correlation of the experimental curve to the actual curve I was not able to find the R2 value.
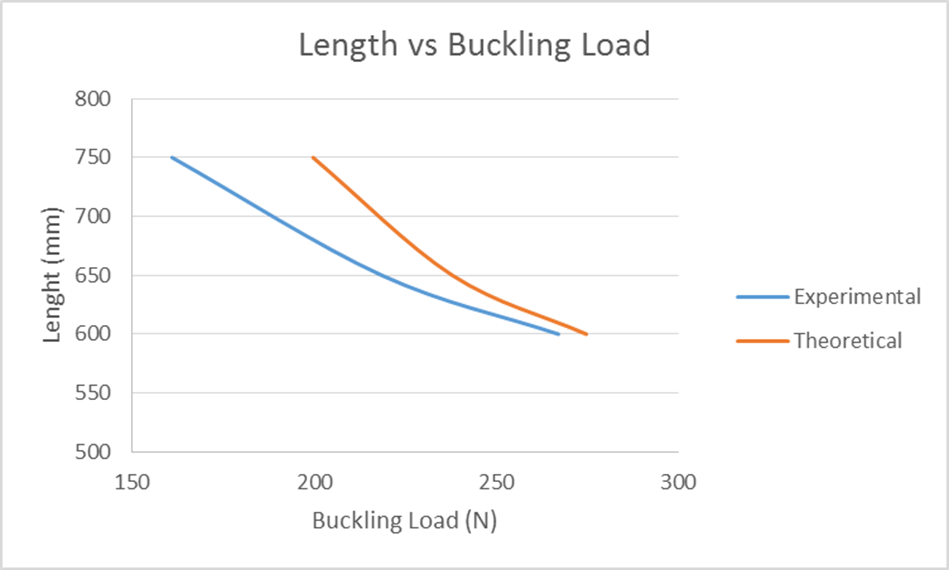
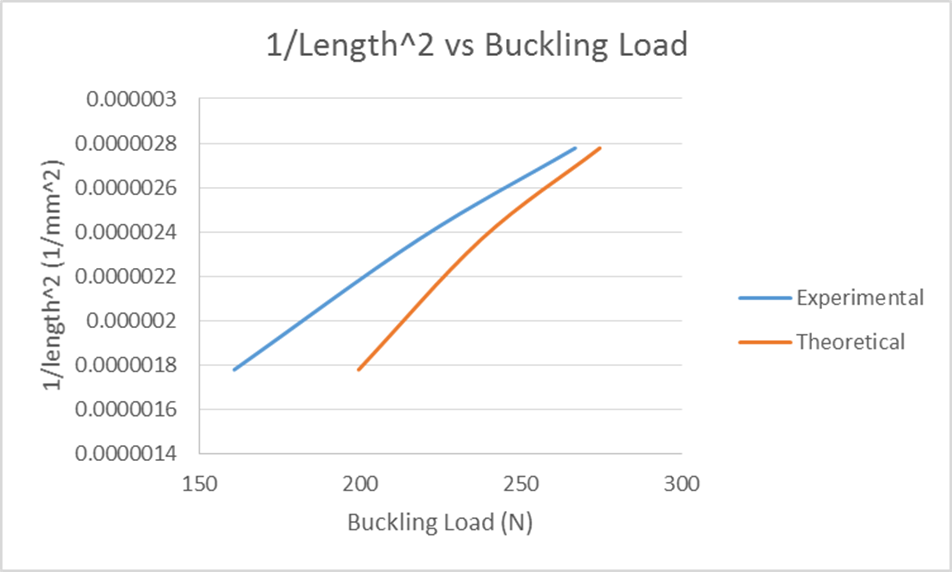
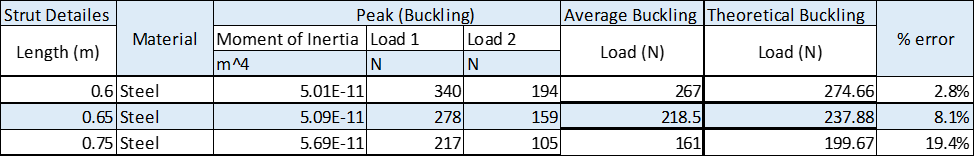
For the second part of the experiment, buckling loads were recorded as the length of the strut was changed. As expected the longer the beam is the lower the load that it can take before it buckles. The relationship between the length and the load seems to be an inverse linear function. For the most part, the data acquired was good with the highest % error at 19% error. I noticed that as the beam length increased, the % error increased. The first two measurement values have % errors of 2.8-8.1% error.
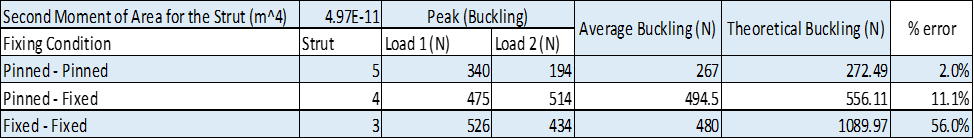
Finally for the final part of this experiment the end conditions were changed. What was noticed during this was that theoretically the fixed end should be 4 times as strong as having a pinned end. And when you used the equation that is the information that you find but in reality that is not what was measured. The fixed-fixed end conditions were only 1.8 times stronger than the pinned-pinned end conditions. I believe some of this error could have been that when the buckling occurred the harder lash back of the beam could have possibly loosed up the chucks causing an error in the forced measurement. The % error for this experiment ranged from 2%-56% error with fixed-fixed end support having the highest % error.
References:
Experiment #9 Buckling of Columns, Mechanical Measurements, Laboratory Procedure, Department of Mechanical Engineering Widener University