Determining Material based on Mechanical Properties
Objective
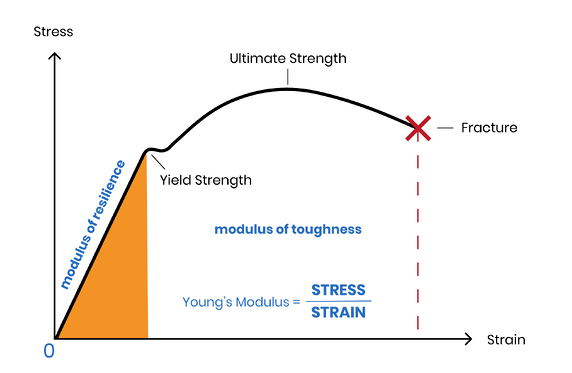
The object of the experiment is to determine the material of an unknown specimen based on the material young’s modulus(E). Young’s modulus is the ratio of the stress to strain in the plastic region of the stress-strain diagram. This mechanical property is material specific. The data which was gathered during this experiment is as follows:
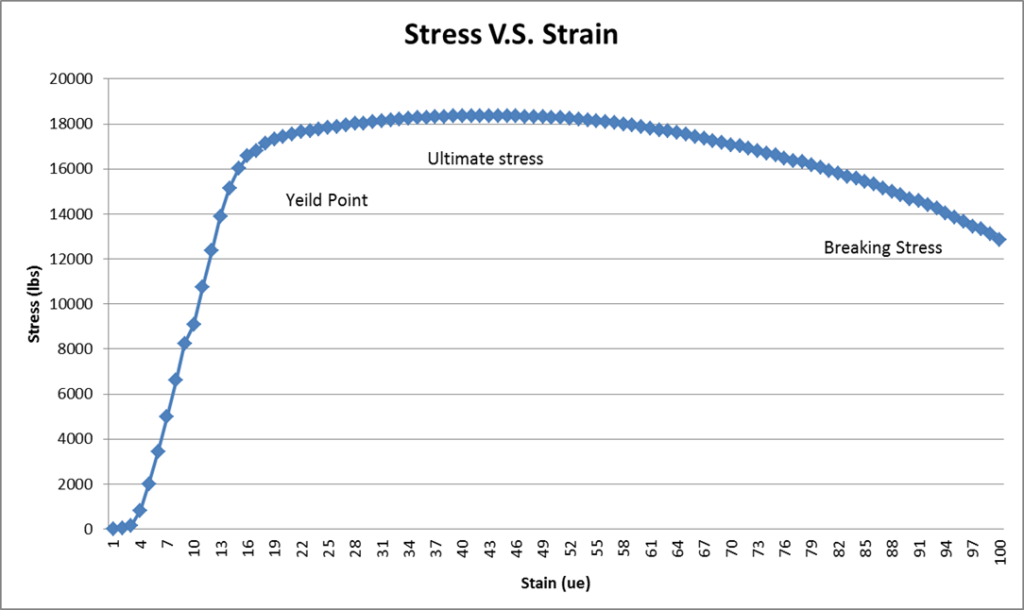
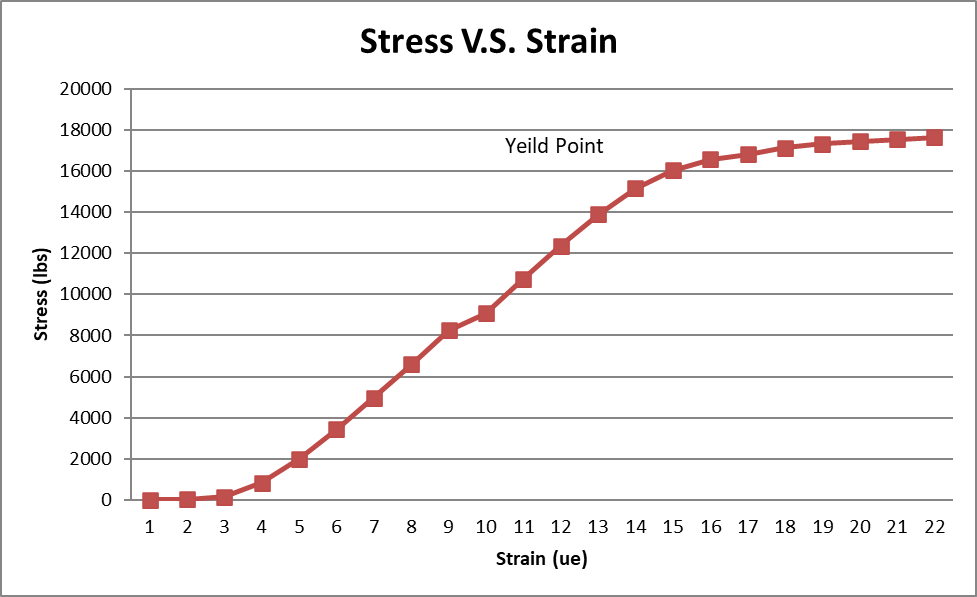
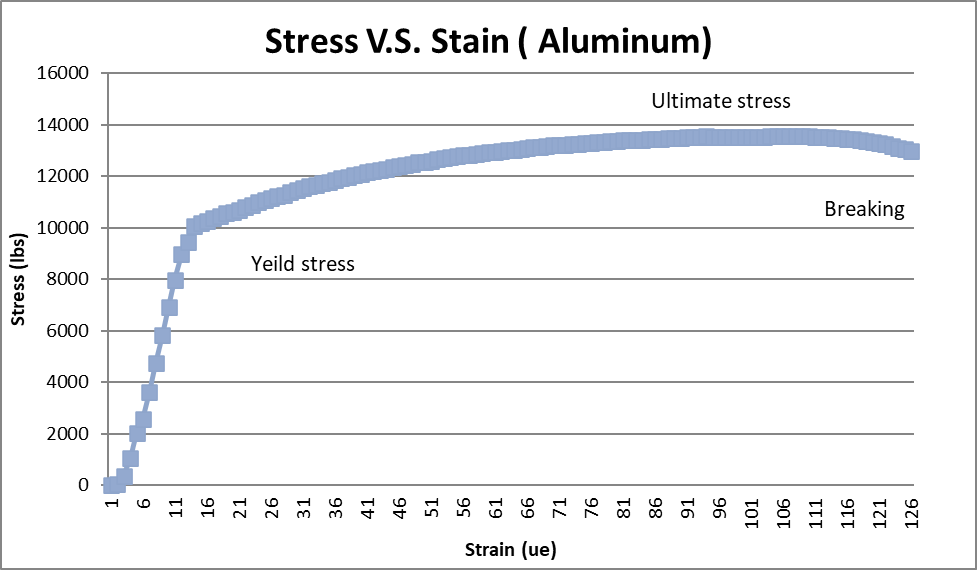
- yield strength – Just beyond the elastic limit (end of the linear part of the stress-strain diagram) is permanent deformation known as yielding
- ultimate strength – the maximum stress a material can withstand
- breaking/fracture stress- if the material is stressed beyond its ultimate stress then the fracture, or breaking, is the strain the material can withstand before fracturing.
Known/Assumptions/Procedure
Material list needed to perform this experiment includes – specimens 1&2, Satec unidrive model 50UD, micro measurements D4 data acquisition unit, a bridge, wires, cat 5 end, magnet, Fluke 62 mini IR thermometer, vernier calipers, stress gauge, screwdriver, safety glasses, safety shield, and a laptop.
- To start the experiment connect the cat 5 that comes from the Satec to the second slot in the data acquisition unit. Then connect the cat 5 that is attached to the strain gauge into the first slot in the data acquisition unit.
- The next step is to check which specimen is ferrous using the magnet.
- Once you have identified the ferrous material takes its temperature using the Fluke thermometer. Repeat the last step with the non-ferrous specimen and record both temperatures.
- Once the temperature has been recorded make sure you zero out the vernier calipers. Once calipers have been zeroed out, get a reading on the diameter of the specimen (make sure you are below the filet but still close to the end of the specimen). Once a reading has been taken turn the calipers 90 degrees at the same place and get a second reading. Recorded both readings.
- Repeat the previous step but this time take measurements from the center of both specimens. Then take measurements at the opposite end of the specimen.
- Once you have 6 measurements for both specimens, find the average diameter for both specimens, and record it. Using this diameter calculate the cross-sectional area.
- Attach the strain gauge to both specimens following the instructions provided by the manufacturer.
- Connect the strain gauge to the screw terminals in the bridge. Make sure to securely fasten all the cables to the bridge (black with black, white with white, & red with red).
- Once the specimen is inside the top half of the collet, place the other half of the collet that is labeled with a 5 on the top to secure the specimen inside the unit. Make sure both halves of the collet are flush. Then drop the color to secure the system.
- Turn on the Satec unit.
- Jog the Satec unit up or down to make sure the specimens fit inside the bottom collets.
- Repeat step 9 with the bottom half of the collet which is labeled with a 6.
- Make sure there is some wiggle room in the specimen to record the best data.
- Make sure to start the program for the data acquisition unit.
- Save the file before you start.
- Enter gauge factor into the software.
- Place a safety shield in front of the specimen and make sure safety glasses are on.
- Press record and start applying the load on the first specimen (make sure there are no external forces on the Satec during the experiment).
- After the specimen fails press close capture to stop recording and resave information.
- Carefully remove the specimen from the Satec.
- Put the specimen back together and take measurements at the center where necking resulted due to the stress. Record new diameter which will be used to calculate % reduction in area.
- Repeat steps 9-21 with the second or non-ferrous specimen.
Equations/Givens
The theory behind this experiment is to find out which material would be best for different applications.
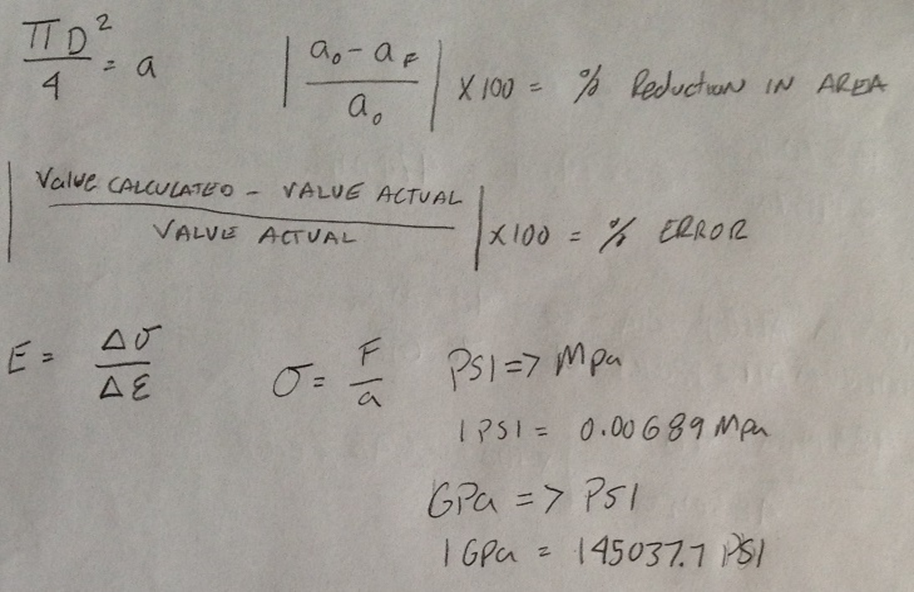
Equations:
Tables :
| Typical tensile strengths of some materials | |||
| Material | Yield strength (MPa) | Ultimate strength (MPa) | Density (g/cm³) |
| AISI 4130 Steel, water quenched 855°C (1570°F), 480°C (900°F) temper[10] | 951 | 1110 | 7.85 |
| Aluminium alloy 6061-T6 | 241 | 300 | 2.7 |
| Aluminium alloy[16] 2014-T6 | 414 | 483 | 2.8 |
| Stainless steel AISI 302 – Cold-rolled | 520[citation needed] | 860 | 8.19 |
| Steel, API 5L X65[12] | 448 | 531 | 7.8 |
| Steel, high strength alloy ASTM A514 | 690 | 760 | 7.8 |
| Structural steel ASTM A36 steel | 250 | 400 | 7.8 |
| Typical properties for annealed elements[36] | |||
| Element | Young’s modulus (GPa) | Offset or yield strength (MPa) | Ultimate strength (MPa) |
| silicon | 107 | 5000–9000 | |
| tungsten | 411 | 550 | 550–620 |
| iron | 211 | 80–100 | 350 |
| aluminium | 70 | 15–20 | 40-50 |


Results
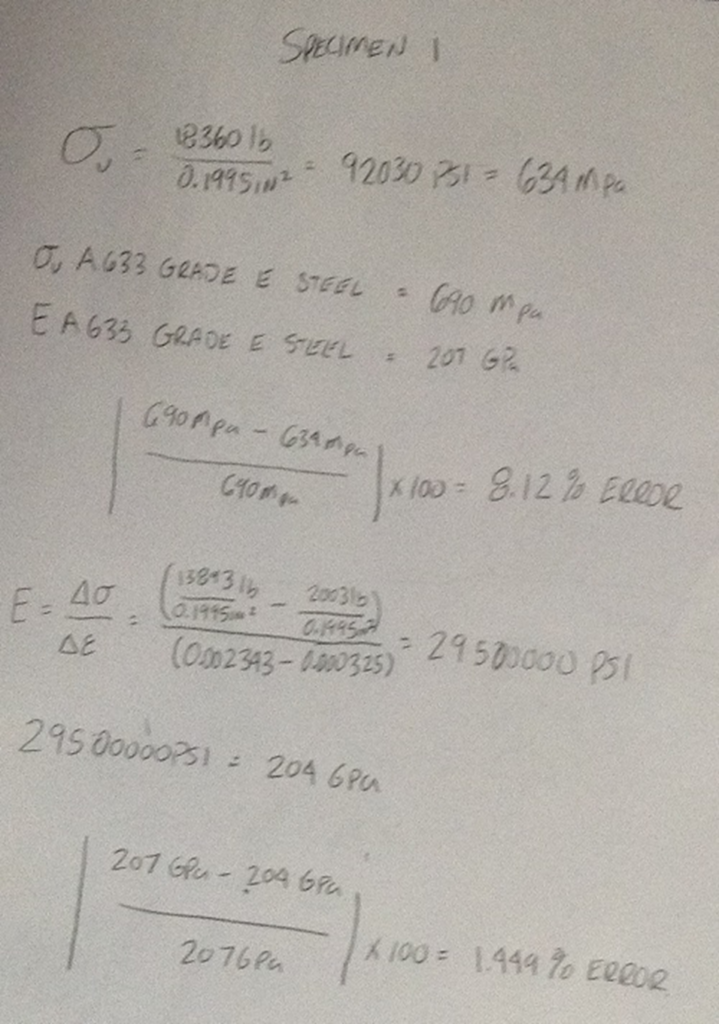
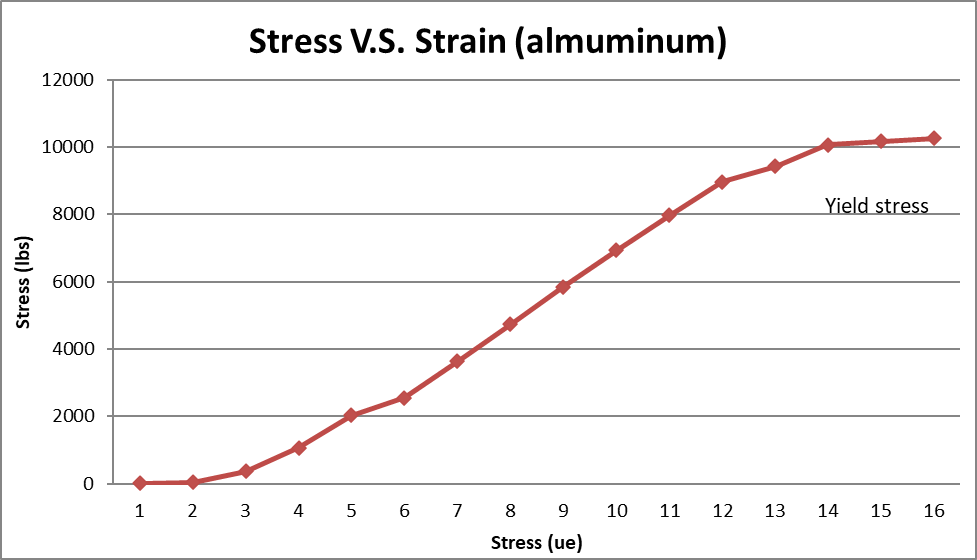
After performing this experiment and evaluating the stress-strain diagram the material properties for specimen 1 match most closely to A 633-grade steel. specimen 2 matches most closely to Aluminum alloy 2014-T6. Some of the differences between the calculated and actual data were for instance with the calculated stress in specimen1 where the calculated stress was 634 Mpa and the actual was 690 Mpa resulting in an 8.12% error. The young’s modulus for specimen 1 was calculated at 204 Gpa where the actual was 207 Gpa resulting in a 1.449% error. In specimen 2 the stress was calculated at 471 Mpa where the actual was 483Mpa which resulted in a 2.48% error. Also with specimen 2, the young’s modulus was calculated to be 66.9Gpa where the actual was 70Gpa resulting in a 4.42% error. Some of the factors that could have increased the percent error were for instance when the strain gauge was bonded to the specimens they were not correctly bonded it could have increased the percent error. Also the accuracy and quality of the strain gauge used could change the data. Another possible problem is that only one trial was done for both specimens, much more accurate data could have been acquired if two or three trials would have been done. Some of the material properties found in this experiment included young’s modulus, ultimate, yielding, and breaking stress. Some material properties not acquired from the experiment but were found in a table included; the density, ductility, compressive stress, and coefficient of thermal expansion.
Conclusion
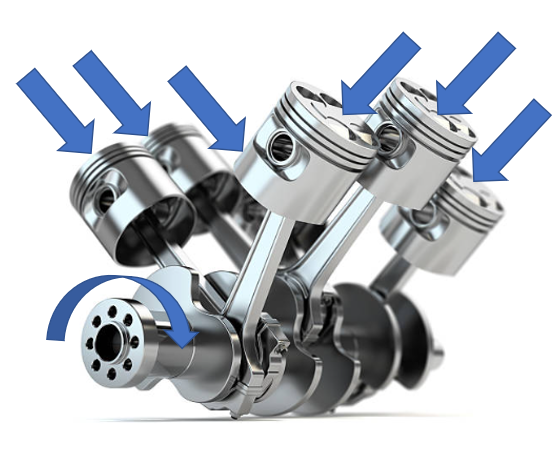
This experiment would be done in the industry to check the quality and straightness of the materials used in the products fabricated. A few of the industries that would use this test would be the automotive, construction, and aviation industry. The automotive industry would use this test to measure the strength of the frame of the vehicle, as well as to test the strength of the internal parts of the engine or transition. To make sure the materials they are using to build their cars are able to withstand the everyday stresses and loads a vehicle must endure. The construction industry would use this test to check the quality of the material they are putting into the steel beam to make sure the beams are able to support the bridge or building they are designing them for. The aviation industry would also use this test to also make sure the quality of the material going into planes and helicopters meets standards. As they test lighter-weight metals to make sure they are still strong enough to hold together. I would recommend using steel in applications where a stronger material is required due to its higher ultimate stress and young’s modulus. But, if weight is an issue aluminum is a lot less dense than steel making it a good candidate. Or if you are in a certain situation where you cannot have ferrous material steel would be a better candidate.
Sources:
http://www.engineersedge.com/material_science/yield_strength.htm
person’s statics and strength of materials 7th edition, pg 480