Uniaxial tension test
Tension test, alternatively referred to as tensile testing or uniaxial tension test, is one of the most commonly used tests to determine important material parameters such as Young’s modulus, yield strength, ultimate strength, elongation at break, Poisson’s ratio, and Lankford coefficients (R-values). Tension testing constitutes a foundational test in materials science and engineering, involving the controlled application of tension to a sample until it reaches failure.
Engineering products go beyond aesthetics, requiring strength suitable for their intended applications. The strength of a component is inherently tied to the properties of the materials comprising it. Engineers face the crucial task of selecting appropriate materials for their designs, emphasizing the need for a comprehensive understanding of material properties. Material testing becomes pivotal in this context, offering diverse tests to assess material suitability for specific applications.
Why should you conduct a uniaxial tension test?
Tensile testing serves as a destructive process revealing vital characteristics of metallic materials, including tensile strength, yield strength, and ductility. This method gauges the force required to break a specimen and measures the extent of elongation until failure. Complying with standards like ISO 527-4, ISO 527-5, ASTM D 638, ASTM D 3039, and ASTM C 297. Results offer stress-strain diagrams for determining tensile modulus, tensile strength (yield and break), tensile strain, elongation, and percent elongation at various points.
Critical in composite testing is alignment due to anisotropy, where material properties vary based on force direction. Aligning tests with the fiber orientation is vital for accurate results, especially in the aerospace industry where composites face high-tensile-stress applications. Various gripping mechanisms are available for ambient, sub-ambient, and high-temperature testing, providing essential data for material selection, part design, and quality control.
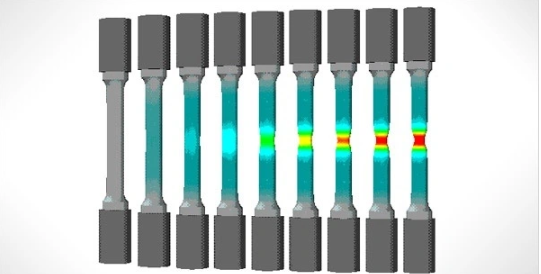
Uniaxial Tension Test Sample Geometry
Achieving a successful uniaxial tension test is greatly influenced by the shape and dimensions of the test sample. While tension tests can be adapted to various objects using customized grips, the standard practice involves testing raw materials by shaping them into “Dogbone” samples. This term describes a distinctive shape characterized by elongated ends that widen, resembling a dog bone. The central section, known as the “gage region,” is intentionally narrower to enhance susceptibility to failure, while the broader ends facilitate secure gripping by the testing machine.

Dogbone samples can exhibit cylindrical or flat configurations, with the latter being more prevalent. The dimensions of dogbone samples for tension testing vary depending on factors such as material type, applicable standards, and intended use. However, a widely accepted standard size typically features a gage region measuring approximately 60x12mm.
What is uniaxial tensile strength?
Uniaxial tensile strength is the load that a material can withstand as it is being pulled apart. To conduct this standardized test, a material is machined to the specified shape and must hold a designated tolerance. the material is then gripped at both ends by an apparatus, which slowly pulls on the material until it fractures. The object of this experiment is to see how different engineering materials respond to tensile forces.
The reason for doing this experiment in the industry is because it is a cost-effective way to ensure that the material you are selecting, is going to withstand the forces and stresses during everyday use. When a new material is developed the mechanical properties are not always known, so the goal of conducting mechanical testing is to find the yield, ultimate, and breaking stress for any material desired. The material test properties can then be inputted into CAE software which OEMs can then use to generate virtual models.
What is uniaxial stress?
A uniaxial stress or force is when a material is loaded in one direction. When a tensile specimen is subjected to a uniaxial loading the force generates tensile stress and strain within the material. Since all
tensile specimens are thinnest in the middle, all the load acts upon this area of the test samples.
Manufacturers want to ensure that they are selecting a material that would be best suited to their specific applications. To make sure that materials that are picked will not fail due to being over-stressed or strained.
The strength of elongation is a measurement that can be determined by the change in the length of the specimen after the test has been conducted. The strain rate is the change in deformation of the test specimen with respect to time. Below is an example of an engineering stress-strain diagram.
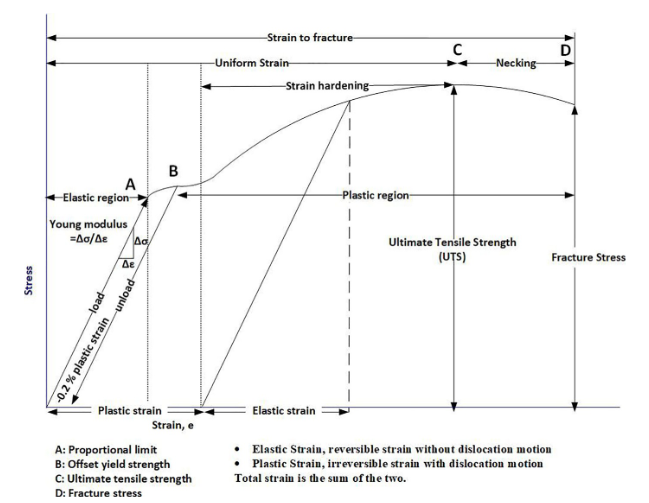
σy represents the yield point, that is, the end of elastic behavior characterized by Young’s modulus (E) which is a material-dependent property. After a material hits its yield strength, it enters the plastic deformation which is associated with strain hardening. Eventually, increased loading will culminate in failure.
What are the elements of the stress-strain curve?
The stress-strain curve gives design engineers a comprehensive set of critical parameters for the design of their applications. Below are mechanical properties that can be derived from the stress-strain graph:
The modulus of elasticity (E) is a measure of the stiffness of an engineering material. E value is material dependent. Typical values of E are:
E =30×106 psi (209×103MPa) for steel and 106 psi (69×103MPa) for Aluminum.
Proportional limit: is the point in the elastic region where the stress-strain relationship starts to deviate from the linear relationship.
Elastic limit: The maximum stress beyond which the material starts to exhibit plastic deformation
Yield point (Y): When the stress-strain relation starts to exhibit plastic deformation. Some materials exhibit yield region and others do not show it. When the material does not show an abrupt change in the slope, the yield is determined by proof strength. Proof strength (a measure of yield strength) is the stress at which a strain offset of 0.2% from the straight line has occurred
The area under the stress-strain curve up to the yield point Y or the proportional limit point is known as the Modulus of resilience:
Modulus of resilience = Y ey /2 = Y2/2E lb/in.3
Poisson’s ratio (n) is the absolute ratio of the lateral strain to the longitudinal strain.
Plastic region: After the yield point, with ductile materials, as the load increases the workpiece increases in length and keeps the uniform cross-sectional area up to a point when the workpiece starts to exhibit necking. After the onset of necking, the load starts to decrease until a fracture occurs. The load at the start of necking is called maximum load (Fmax), and the stress at this point is called ultimate tensile strength (TS): TS = Fmax/Ao
Necking: when the maximum load reaches the workpiece shows necking then the load starts to decline and localized elongation occurs until the workpiece fractures. The stress immediately before fracture is called fracture stress.
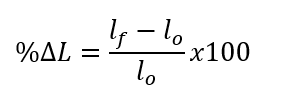
Elongation: It is the total amount of strain that the material can endure before failure. It is measured by the percent elongation of the test specimen and computed as EL% = [(Lf – Lo)/Lo]x100
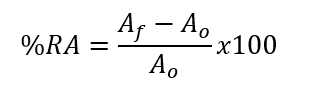
Where Lf is the final gage length before fracture. Ductility is also measured by Area Reduction (AR): another measure of ductility is the percent reduction in the area defined as AR% =[(Ao – Af)/ Ao ]x100
What is the purpose of doing a uniaxial tension test?
This experiment would be done by either engineers or material scientists to check the tensile properties of the materials used to fabricate products. Several different types of tensile tests could be conducted in the industry from a regular specimen pull test to an adhesion/bond strength test and a tear resistance test. A few of the industries that would use this test would be the automotive, metal/construction, and aerospace/aviation industries.
The automotive industry would use this test to measure the strength and structural rigidity (frame stiffness) of the body-in-white (BIW), a good material selection can turn a good BIW into an excellent BIW, assuming the BIW already has a good structural load path.
An area where this is used extensively is during sheet metal stamping, While stamping a part automakers want to exceed the yield stress to ensure that the part will hold its intended form. However, they must be careful not to exceed the fracture stress as that could result in a tear in the sheet metal.

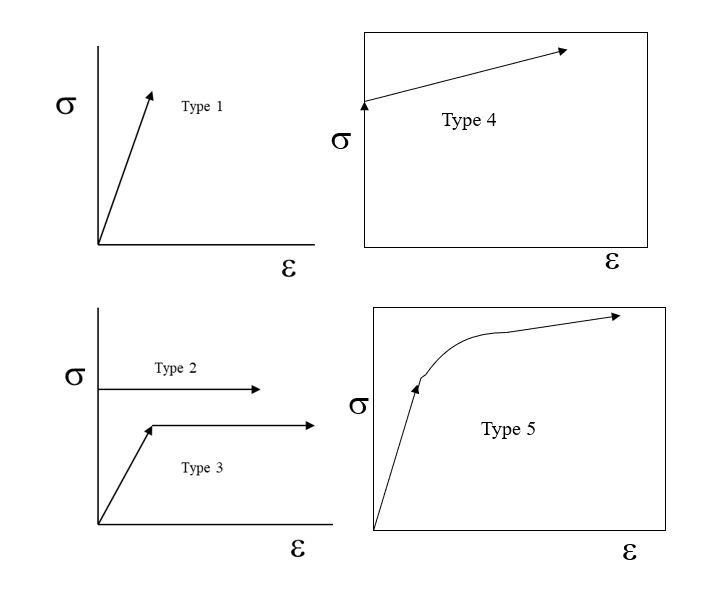
Types of stress-strain curves
- Perfectly elastic material
- Behavior measured by E,
- No plastic deformation or negligible, if any.
- Typically, ceramics, glass, cast irons
- Rigid perfectly Plastic
- E = inf.
- Once stress reaches Y, it continues to undergo deformation at the same stress level.
- Elastic, perfectly plastic:
- Material has stiffness E, and once stress reaches Y, it deforms plastically, i.e. K=Y and n=0.
- A rigid, linearly strain-hardened material
- The flow stress increases with increasing strain
- Elastic and strain hardening
- Obeys Hooke’s law in the elastic region, sigma = Ee
- In the plastic region, it follows the relationship: sigma = K en
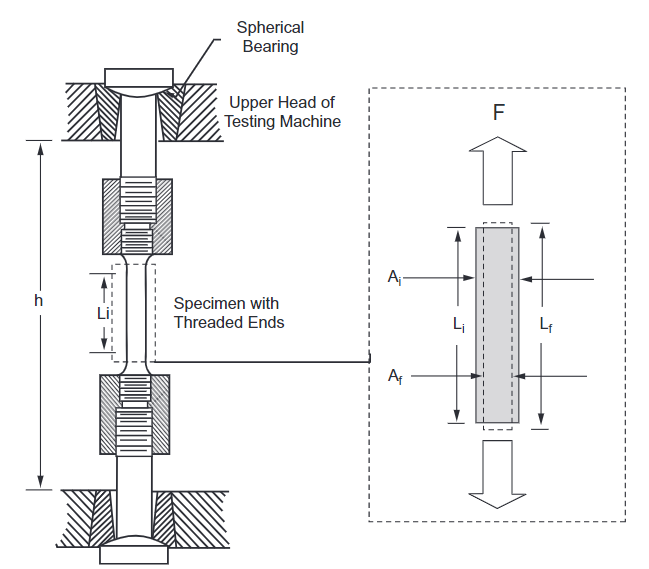
What equipment is used to conduct a uniaxial tension test?
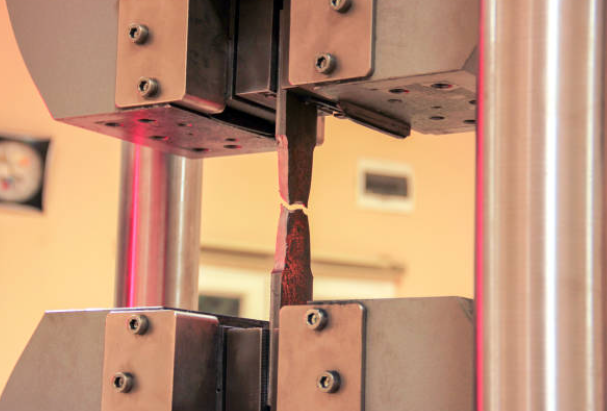
Tensile testing, commonly performed in material testing laboratories requires a pull tester or universal testing machine (UTM). Utilizing protocols such as ASTM D638 to measure plastics’ tensile properties. The universal testing machine is a prevalent choice, either electromechanical or hydraulic, with the former providing versatile test speeds and long displacements, while the latter is cost-effective for high-force applications.
Machine capabilities, including force capacity, speed, precision, and accuracy, are crucial, considering the need to generate sufficient force, mimic application conditions, and accurately measure gauge length and forces. Proper alignment of test specimens is vital to avoid bending forces, particularly detrimental to brittle materials. Strain measurements employ extensometers or strain gauges, with modern digital systems and analog machines meeting and exceeding accuracy standards for metal tensile testing.
Uniaxial tension test procedure:
Materials required:
- The test samples / tensile specimens
- Tinius Olsen Testing Machine
- 2” gauge punch
- Extensometer-2” gauge length
- vernier calipers
- Steel scale
- Safety glasses.
Procedures to conduct a Uniaxial tension test:
- Make sure you zero out the vernier calipers. Once calipers have been zeroed out, get a reading on the diameter of the test samples (make sure you are below the filet but still close to the end of the
tensile specimens). Once a reading has been taken turn the calipers 90 degrees at the same place and get a second reading. Recorded both readings. - Repeat the previous step but take measurements from the center of both test samples. Then take measurements at the opposite end of the specimen.
- Once you have 6 measurements for both specimens, find the average diameter for both specimens and record it. Using this diameter calculate the cross-sectional area.
- Make a 2” gauge mark on each of the specimens using the 2” gauge punch.
- Connect the specimen to the tensile testing machine.
- Once the specimen is threaded to the bottom collet, place the other half jog the machine up to be able to thread the top to secure the specimen inside the unit.
- Install the extensometer on the specimen
- Make sure there is some wiggle room in the specimen to record the best data, to avoid the specimen being under stress before the test has started.
- Start tensile test program on the computer
- Set up the loading rate (position rate) using the computer
- start applying the load on the first specimen (make sure there are no external forces on the Tinius Olsen Testing Machine during the experiment).
- Remove the extensometer from the specimen when prompted by the computer after the material starts to yield but before necking begins
- After the specimen fails carefully remove the specimen from the Tinius Olsen Testing Machine.
- Put the specimen back together and take measurements at the center where necking resulted due to the stress. Record the new diameter, which will be used to calculate the % reduction in area.
- Record new gauge length
- Print the results, which include the stress-strain diagram.
- Repeat steps all the steps with the second test specimens.
How do you calculate uniaxial tensile strength?
Equations:
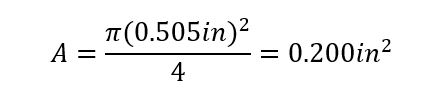
Area (A):
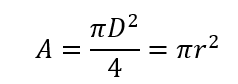
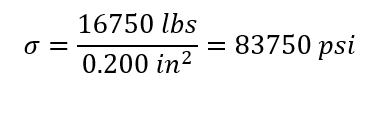
Normal Stress(σ):
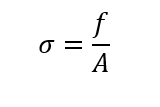
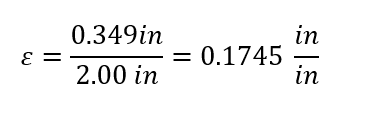
Strain(ε):
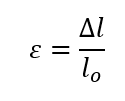
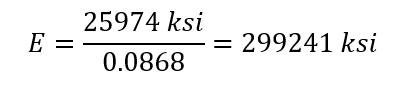
Elastic/young’s modulus(E):
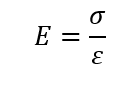
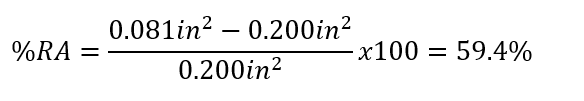
%reduction in area (%RA):
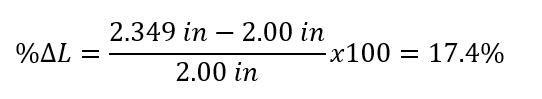
% elongation (%ΔL):
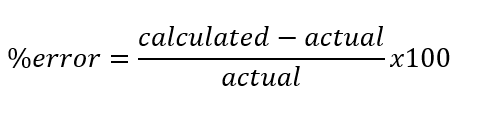
% error:
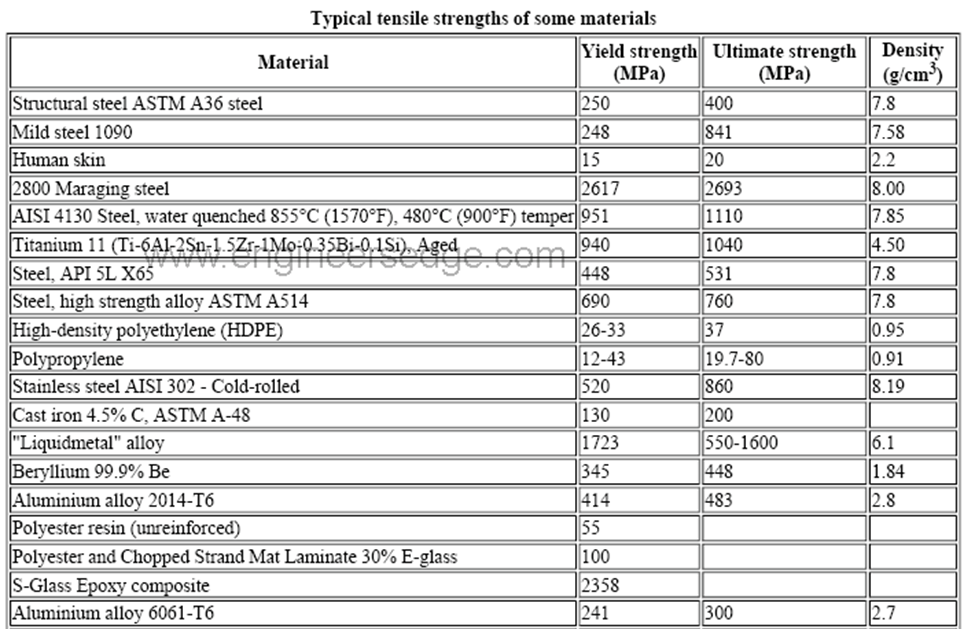
Published data charts:

Show your work
Example calculations (aluminum):
Area (A):
Normal Stress(σ):
Strain(ε):
Elastic/young’s modulus(E):
%reduction in area (%RA):
% elongation (%ΔL):
% error:

Graphs:
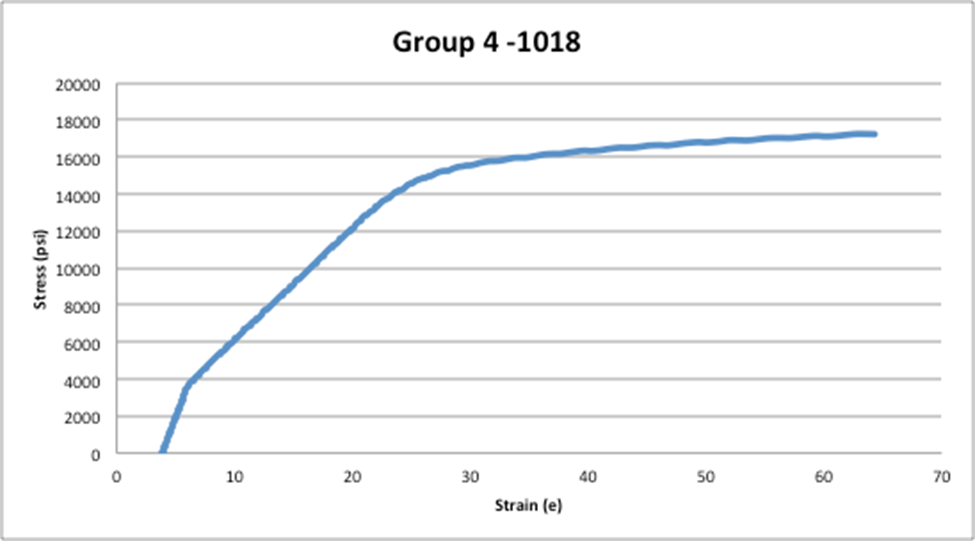
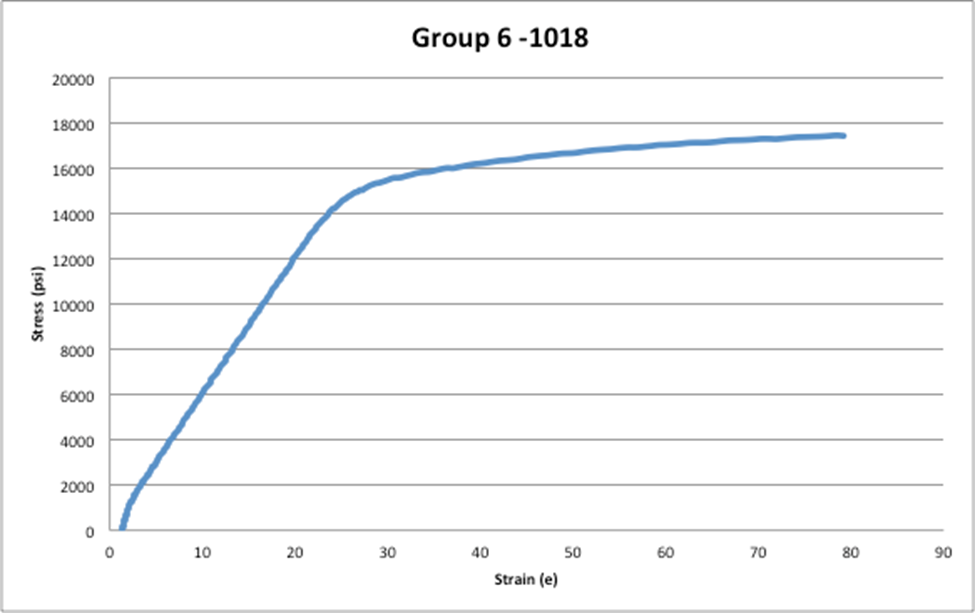
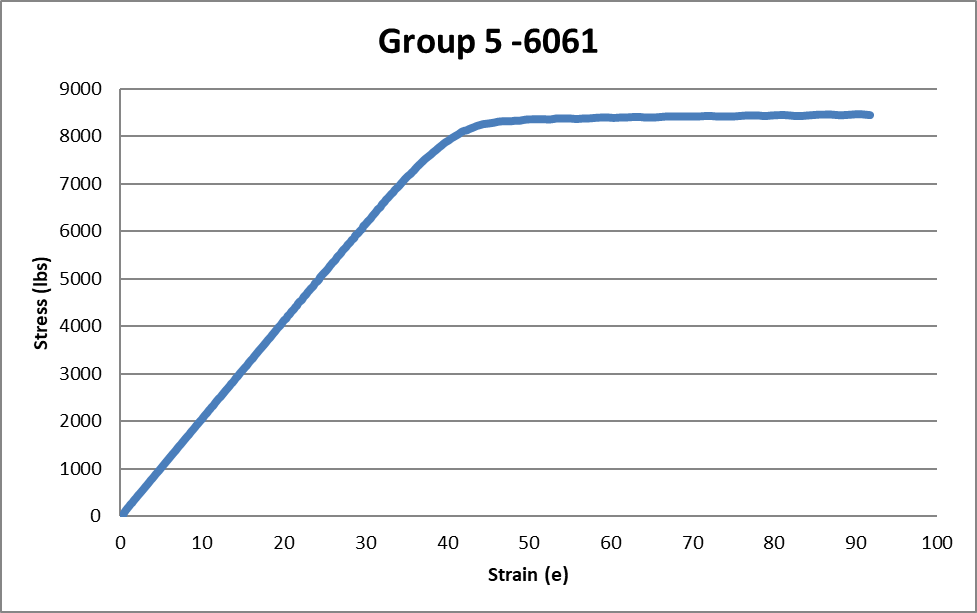
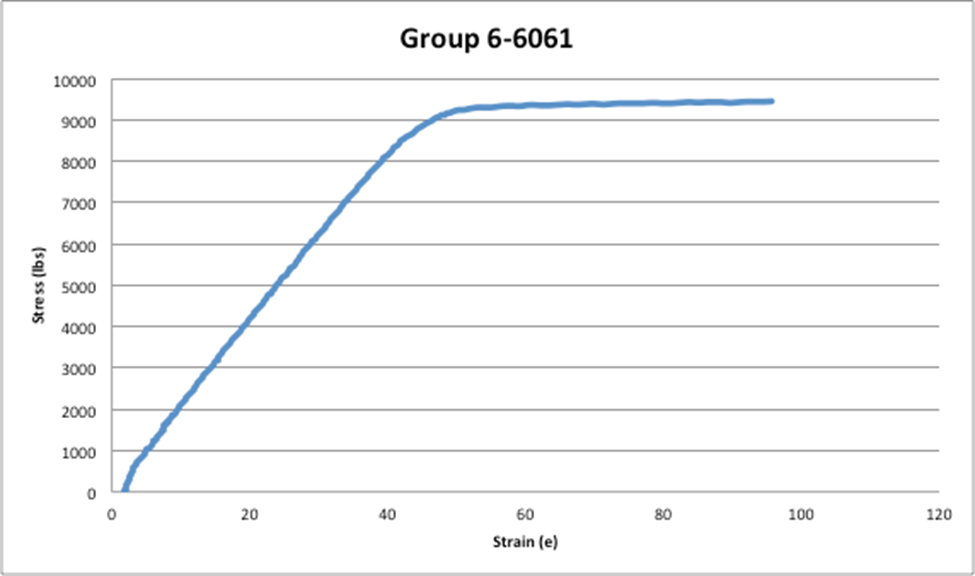
Data sets:
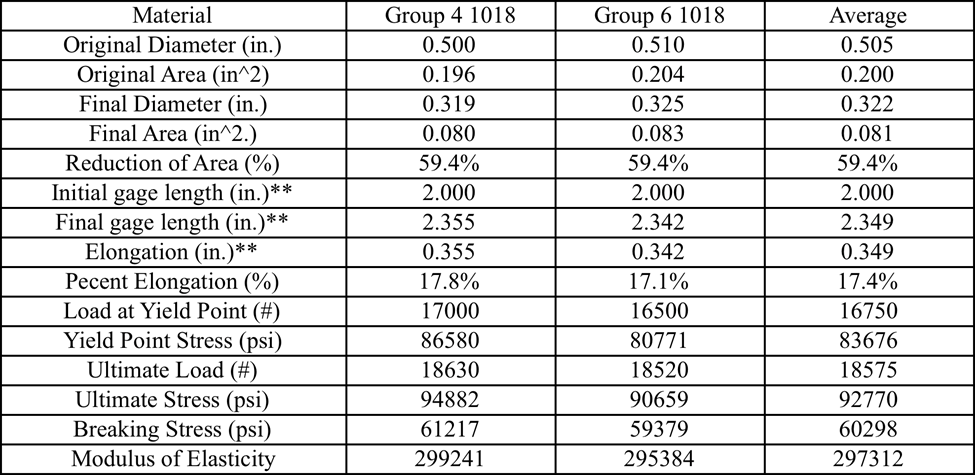
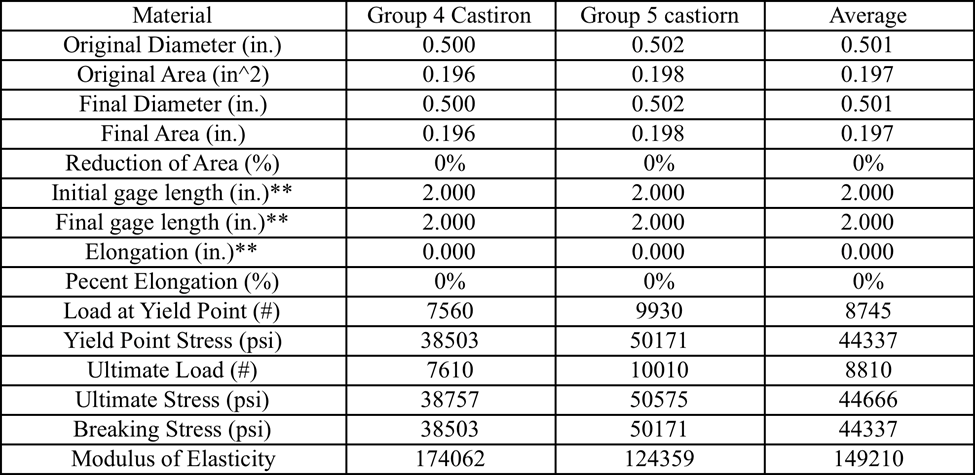
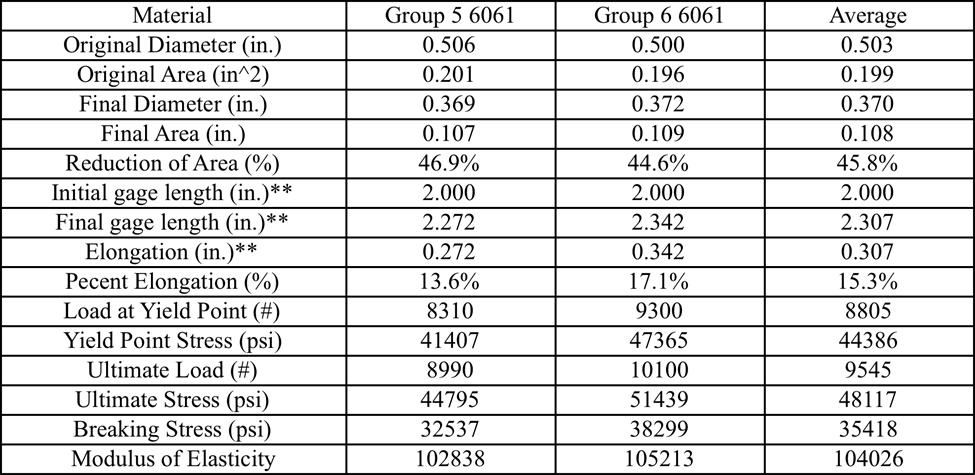
Uniaxial tension test – sample Findings
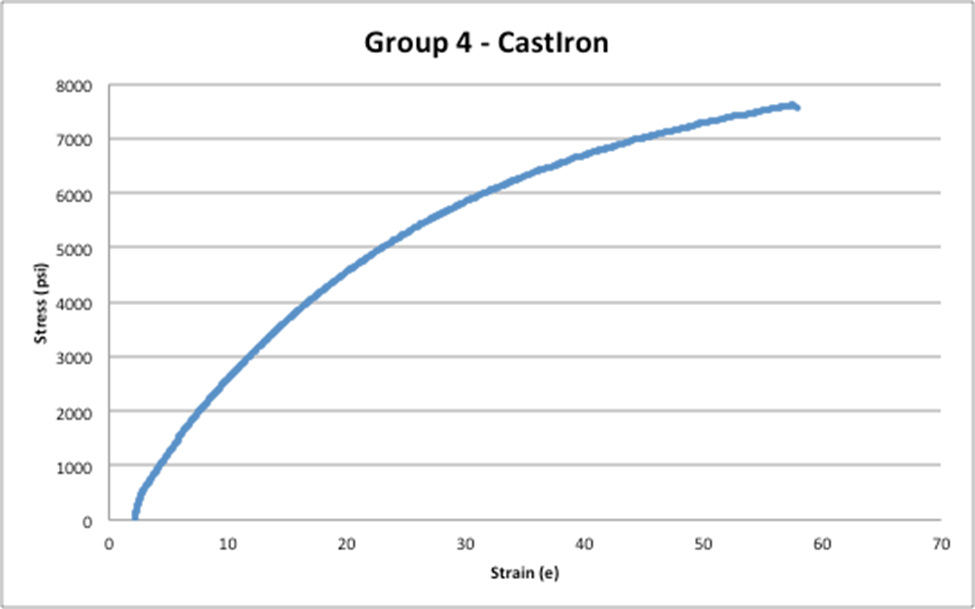
After performing this experiment and evaluating the data the material properties of cast iron were the test specimens with the largest deviation for the true value for many of its properties. One of the reasons that I believe this is so is because when evaluating the stress-strain curve for cast iron there was no clear distinction of where the plastic region of the curve was at or the yield point. It was a much more uniform graph. This might have explained why there was a large difference between the two trials of cast iron.
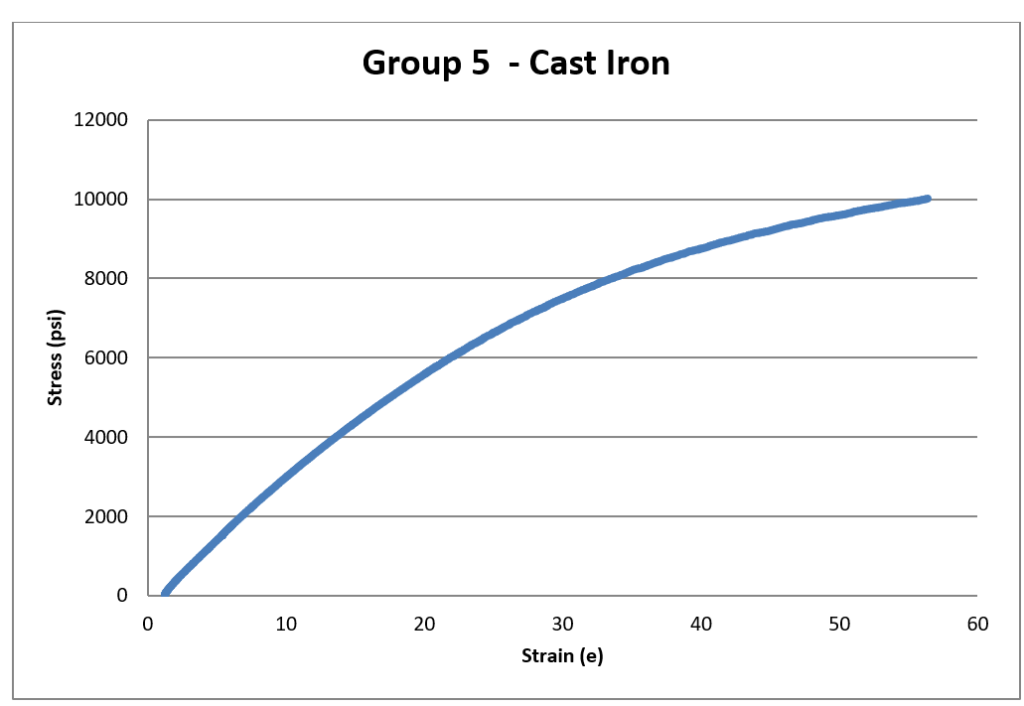
For example, the modulus of elasticity (E) is the slope of the curve during the plastic region so the data points you picked for this calculation would alter the slope of the line because there was no “linear” portion to the graphs as you can see in Figure 1: Group 4- Cast-iron strain vs strain graph and in Figure 2: Group 5- Cast-iron strain vs strain graph, which are located in the graph section.
Some of the differences between the calculated and actual data were for instance the calculated average ultimate stress in cast iron was calculated at 44666 psi and the actual was 200 Mpa which is equivalent to 29007 psi, so with cast iron, there is a significant difference between the actual and calculated values.
On the other hand, when comparing the ultimate strength for the aluminum alloy-6061 the true ultimate strength is 300 Mpa which is equivalent to 43511 psi. The average experimental ultimate strength for this material was 48117 psi which results in a 10% error. Which is not terrible, but it could be better. Finally, the Young’s modulus for 1018 steel alloy was 29700 KSI and the calculated average was 297312 KSI resulting in a 1.05% error.
%error &why:
Some of the factors that could have increased the percent error were for instance when the strain gauge was bonded to the tensile specimens they were not correctly bonded it could have increased the percent error. Also the accuracy and quality of the strain gauge used could change the data.
Another possible problem is that only two trials were done for both test specimens, much more accurate data could have been acquired if three or more trials had been done. Some of the material properties found in this experiment included Young’s modulus, ultimate, yielding, and breaking stress. Some material properties not acquired from the experiment but were found in a table included the density, ductility, compressive stress, and coefficient of thermal expansion.
What is the conclusion of a uniaxial tension test?
As new materials get developed for the automotive industry such as ultra-high strength steel, and advanced high strength steel, OEMs want to ensure that the material properties do meet the desired design specification for whatever they are engineering. They test lighter-weight metals to make sure they are still strong enough to hold together.
I would recommend using steel in applications where a stronger material is required due to its higher ultimate stress and Young’s modulus. If weight is an issue aluminum is a lot less dense than steel making it a good candidate. It is possible to get comparable strength from an aluminum part however it would require increasing the part section, thus increasing the moment of inertia. The downside to this solution is that an aluminum part would have to be overall larger or bulker compared to a steel part to achieve the same strength.
References:
- Engineers Edge, LLC, Yield Strength – Strength ( Mechanics ) of Materials
- http://www.engineersedge.com/material_science/yield_strength.htm
- AISI 1018 Mild/Low Carbon Steel http://www.azom.com/article.aspx?ArticleID=6115
- Morrow H. , Kokernak, R. person’s statics and strength of materials 7th edition, 2010 pg 480 Hiyam Farhat, Chapter 3 – Materials and coating technologies, Editor(s): Hiyam Farhat, Operation, Maintenance, and Repair of Land-Based Gas Turbines, Elsevier, 2021, Pages 63-87, ISBN 9780128218341, https://doi.org/10.1016/B978-0-12-821834-1.00007-1.(https://www.sciencedirect.com/science/article/pii/B9780128218341000071)