Specific Gravity, Density and Viscosity of Liquids
Background and Theory
The object is to determine how the density, kinematic viscosity and dynamic viscosity of a sucrose solution, as the concentration of the solution are varied. Density is defined as ratio between the mass over the volume. [1] The expected outcome of this experiment is that there will be a correlation between concentration and density and concentration and viscosity. See Table 1: Density of Sucrose Solution.
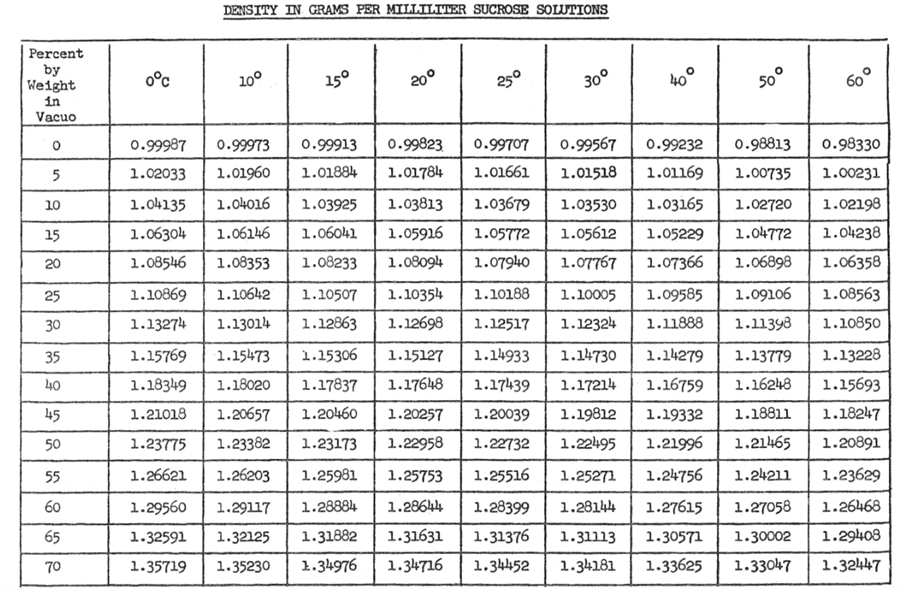
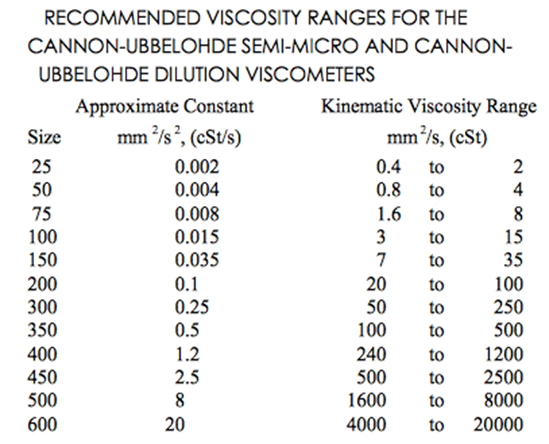
The pattern that is apparent in table 1 is regardless of the temperature, as the percent of sucrose increases the density of the solution increase. All data for this experiment will be conducted at room temperature (20oC). It is also expected just as density is dependent on concentration, so will viscosity. This is expected because as the density increase the solution will become thicker thus increasing its overall density. As the concentration of sucrose is increased it is expect that solution will begin to demonstrate more properties resembling sucrose. [KF1] Refer to Table 2: Recommend Viscometer to be able to pick viscometer, based on expected viscosity.
Experimental Setup and Procedure
To being this experiment five Samples of sucrose water solutions were made with concentration ranging from 10%-50%. Using the scale calculate the mass for a selected about of solution. Using the graduated cylinder to measure the volume of the selected amount of solution. Next use the thermometer measure the temperature of each solution. Once you have the mass and volume, density of each solutions Next use the Hydrometer to measure the specific gravity of each solution. Using the specific gravity calculate the solutions density (density = Specific Gravity * density of water) and compare it to the previously calculated density which was calculated with mass and volume Next use the viscometer to measure the solutions kinematic viscosity. Using the kinematic viscosity calculate and the dynamic viscosity and compare it to the published values.
Experimental Results
After conducting this experiment it is easy to see a correlation between the concentration and the density of the solution. There is a linear relationship between these two variables. As the concentration of the solution increase the density also increases. This conclusion is reasonable as sucrose is lot denser then water, so as the concentration increases it makes sense that the solution would start to show more physical properties of sucrose. Refer to Figure 1: Density vs Concentration below to see the linear relationship

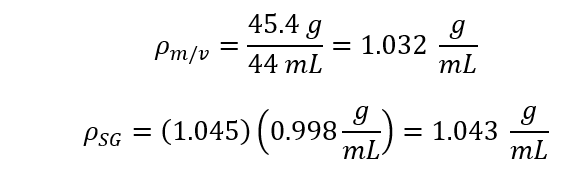
When comparing the accuracy of the calculated density it is also apparent from the graph that by calculating density using m*v you result are more accurate, as there is less outliers with this data. The density can be determined using Eq. 1 and Eq. 2
(eq. 1)
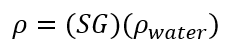
(eq. 2)
Where r is the Density [g/mL], the known density of 20oC is 0.998 g/ml [1]. M is the Mass [g], V is the Volume [mL] and SG is Specific Gravity [-].
There is also a correlation between the concentration of the solution and the kinematic and dynamic viscosity of the solution. The relationship between these two variables is exponential. As the concentration of the solution increases the viscosity increases exponentially. This conclusion is reasonable as sucrose is thicker than water, so with the % concentration this physical property would start to become more prominent. Dynamic and kinematic viscosity can be calculated using Eq. 3 and Eq. 4
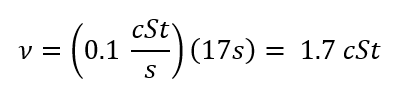
Kinematic Viscosity (n):
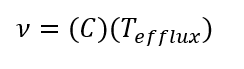
(Eq. 3)
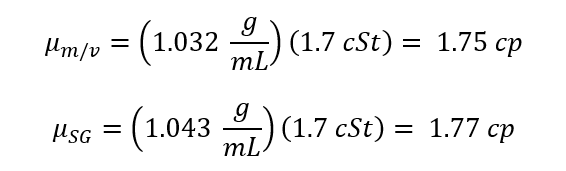
Dynamic Viscosity (m):
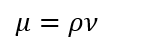
( Eq. 4)
Where r is density [g/mL], m is the Dynamic Viscosity [ cP], n is the Kinematic Viscosity [cSt] and T is Time [s].
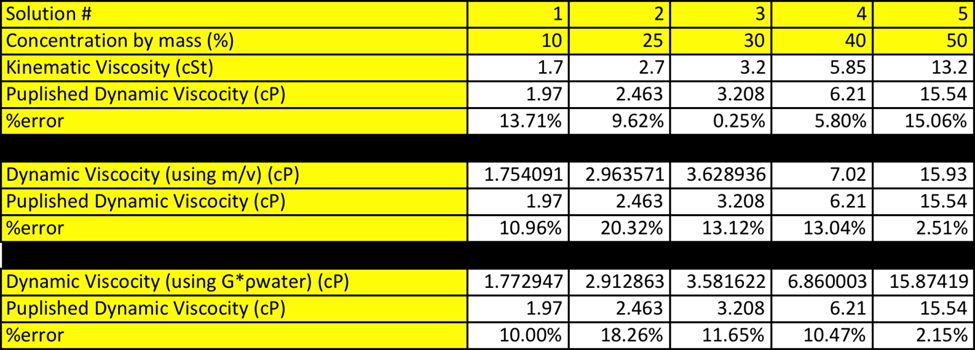
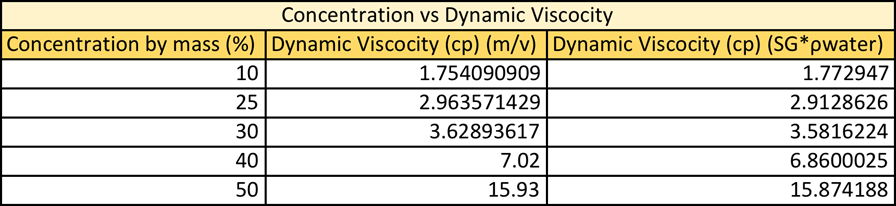
Where the density is calculated using either m*v or SG*rwater. When comparing the graphical result of the dynamic viscosity vs concentration it is very apparent how similar these two data sets are. It seems, as the lines are identical. See figure 2: Dynamic Viscosity vs Concentration. When comparing this data set it is notable that regardless of which equation you use to calculate density the graphs are almost identical.

Discussion
The values that were obtained from this experiment do correlate nicely with the theory. Refer to Table 6: Density vs Concentration in appendix. When looking at the data table you see that both ways of calculating are very accurate. When calculating density using m*v the % errors range form 0.59-2.19% error, with the higher % error at 50% solution. The same trends are seen when calculating density using SG*rwater. The % error ranges from 0.46-2.53% errors with the highest % error also being 50% solution.
When dynamic viscosity was calculated using m*v the % error ranged from 2.51-20.32% error, with the lowest % error, being with 50% solution and the highest being with 25% solution. This does make sense as the 50% solution was already premixed and the 25% solution had to be made. When the dynamic viscosity was calculated using SG*rwater the % error ranged from 2.15-18.26% error. The 50% solution had the least % error and the 25% error having the greatest error.
Conclusion
The conclusion is that there is a linear relationship between concentration and density. As the concentration of the solution is increased, the density will also increase. There is also an exponential relationship between concentration and viscosity. As the concentration increase the viscosity increases exponentially.
Some possible sources of error could have been possibly when preforming this experiment if the graduated cylinders were not completely cleaned off between trials thus tampering with the concentration in the samples. Also the equipment, which was, used measure the volume of the water and sucrose solution was not the best. By preforming more trials or making sure to thoroughly clean and dry all equipment used, in the future this error could be furthered reduced.
References
[1] White, Frank M. Fluid Mechanics. Boston, Mass: WCB/McGraw-Hill, 2016. Print.
[2] Instructions for the use of the Cannon-Ubbelohde Semi-Micro Viscometer, Cannon Instrument Co., State College, PA. 16803
[3] Reference manual for the MacMichael viscometer.
Appendix
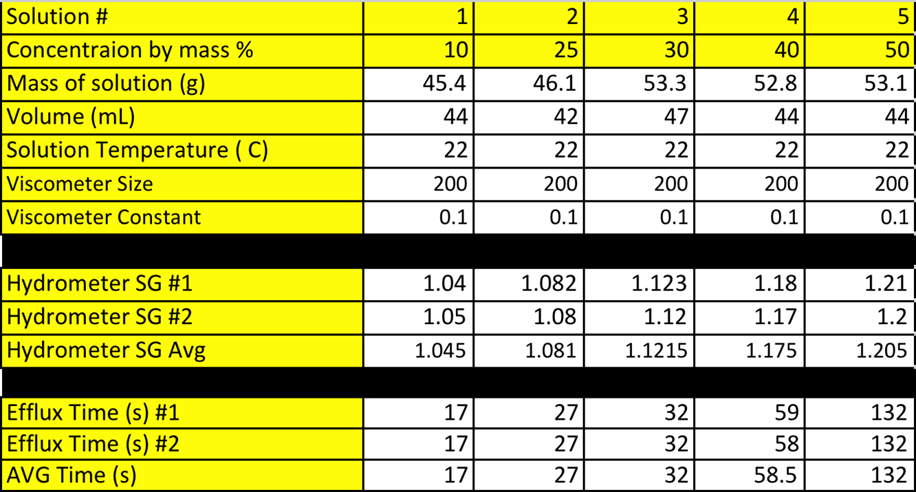
Table A- 1 presents all experimental results taken during the laboratory.


Sample Calculations (10% solution):
Average (SG):

Density (rho):
% error (density):

Kinematic Viscosity (nu):
Dynamic Viscosity (mu):