Combined Stresses in a Pressure Vessel
Objective
To determine the normal stresses in the pressure vessel, and also to observe and material properties of the pressure vessel used. Finally, compare the calculated and measured stresses on the surface of the cylindrical pressure vessel subject to torque while pressurized.
Known & Assumptions
Materials:
The materials required:
- Technovate Stress Analysis System Model 9800
- Strain Indicator
- Computer
Procedures:
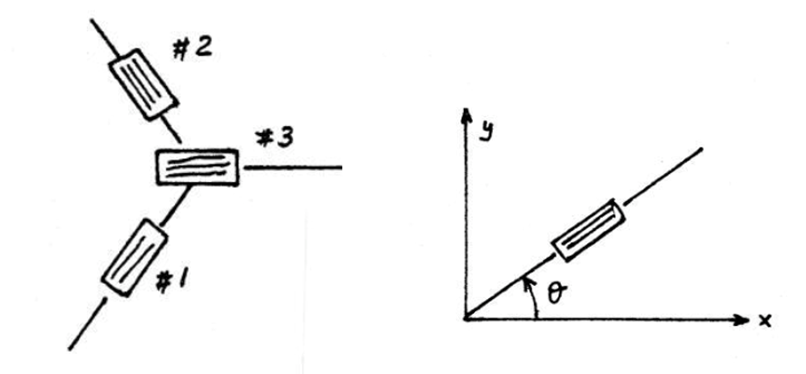
- To begin connect strain gauges1, 2, and 3 to the 60-degree rosette.
- Once gauges have been connected, calibrate strain gauges with the data acquisition unit.
- Making sure both valves are open and the bleeder on the hydraulic pump is closed start to pump up the pressure from 0 psi to 200 psi in increments of 50 psi.
- Afterward, start to slowly relieve pressure from 200 psi down to 0 psi in increments of 50 psi.
- Export data to an excel file and save.
- Connect strain gauges 4 and 5 and repeat steps 2 – 5.
Equations/Givens
Theory:
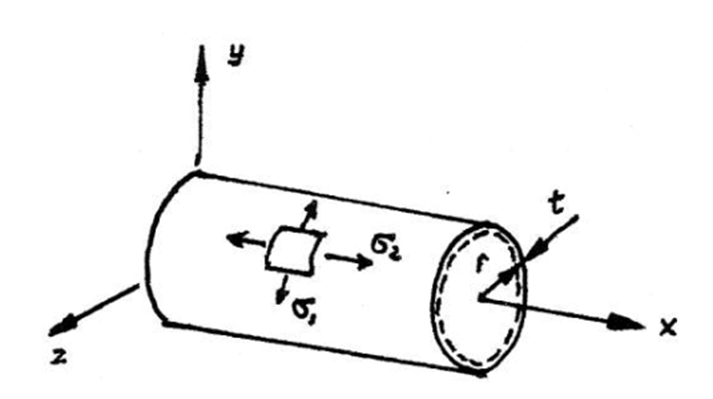
The theory behind this experiment is since the walls of the cylinder are so thin the cylindrical pressure vessel offers little resistance to bending, it is assumed that the internal forces exerted on a given portion of the sidewall are tangent to the surface of the vessel. The forces acting on the wall will be contained in a tangent plane to the sidewall of the cylinder. See figure 1: Cylindrical pressure vessel at the top of the following page.
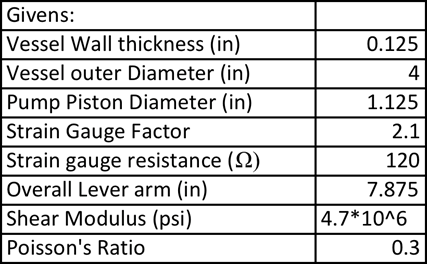
Givens:
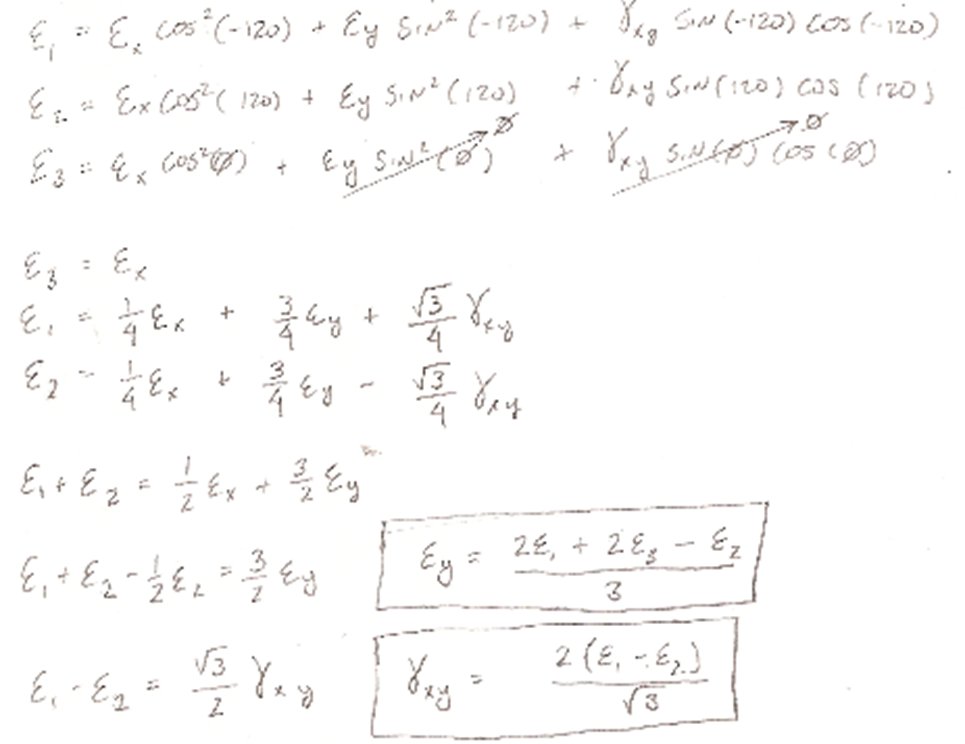
Equations:
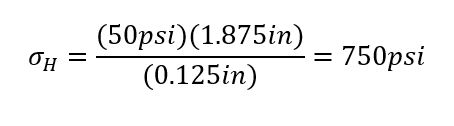
Hoop Stress(σH):

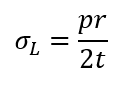
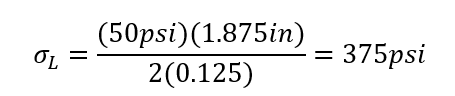
Longitudinal Stress (σL):
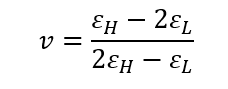
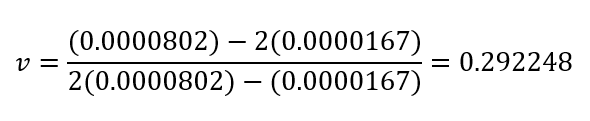
Poisson’s ratio (v):
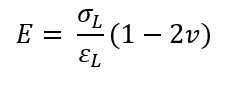
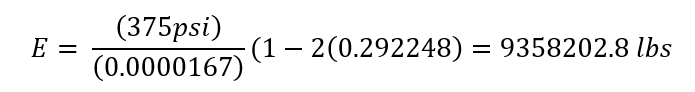
Young’s modulus (E):
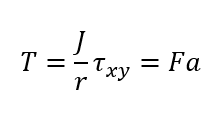
Torque (in*lbs)
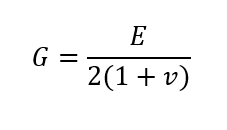
Modulus of rigidity (G):
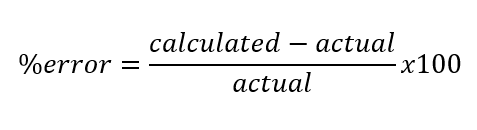
% error:
Example calculations:
Hoop Stress(σH):
Longitudinal Stress (σL):
Poisson’s ratio (v):
Young’s modulus (E):
Torque experimental (in*lbs):
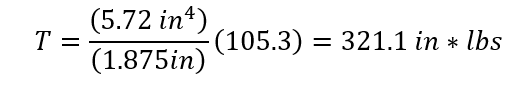
Torque theoretical (in*lbs)

Modulus of rigidity (G):

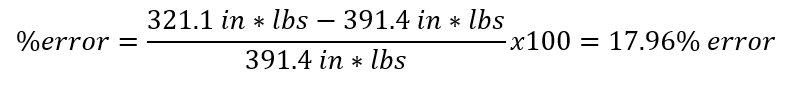
% error:
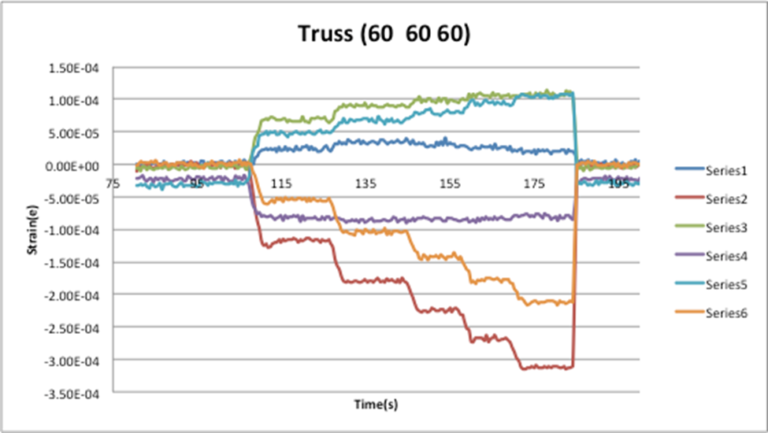
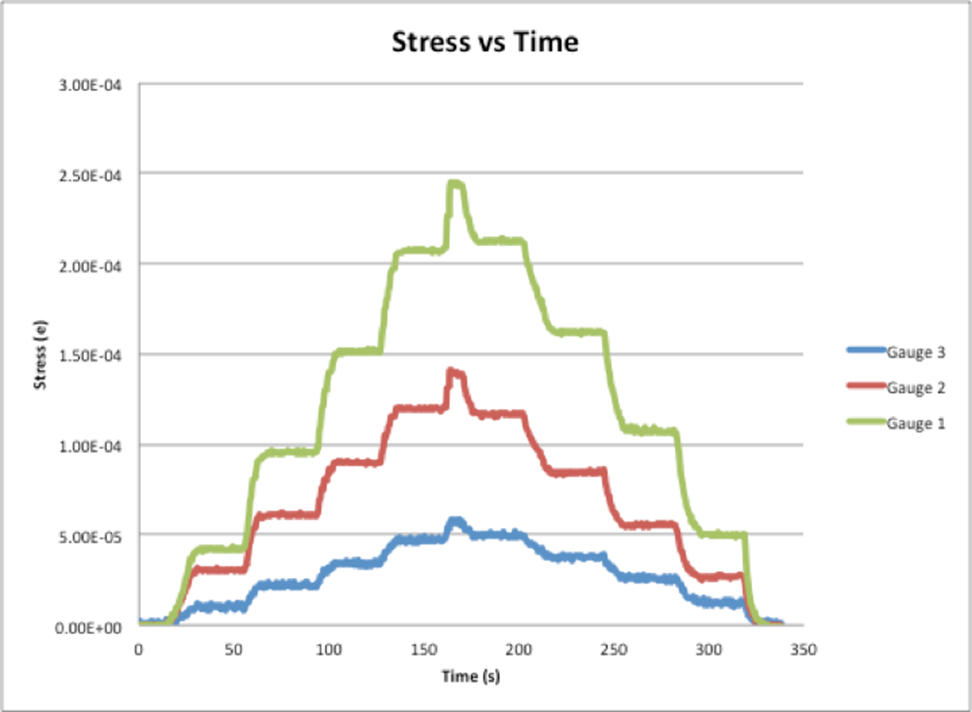
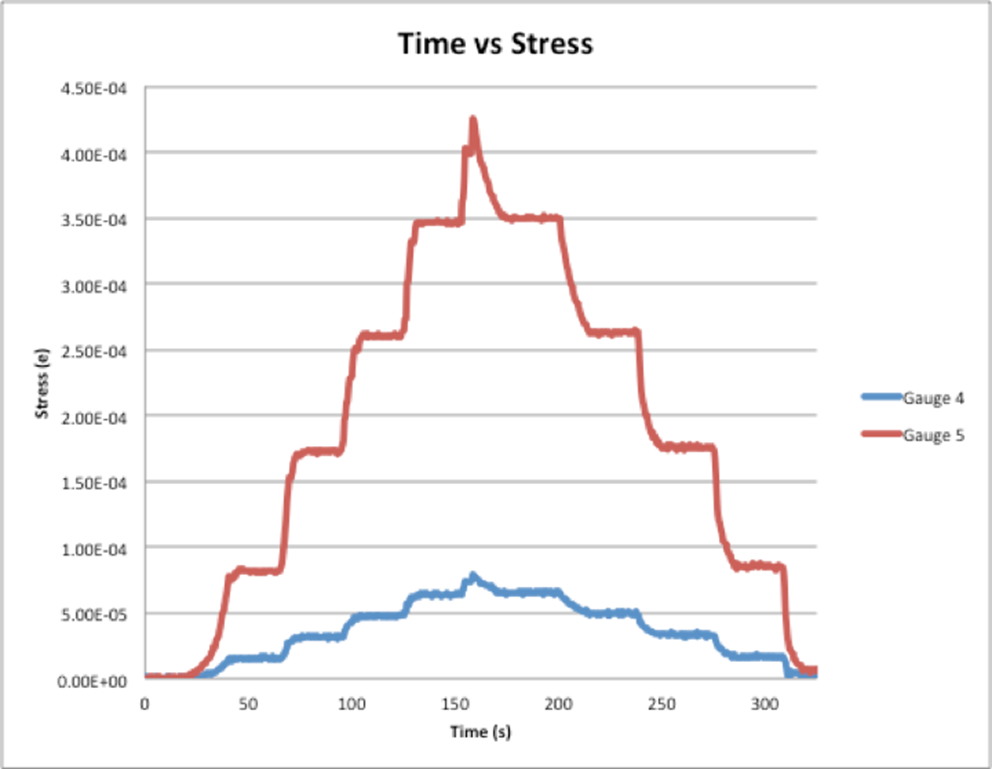
Graphs:
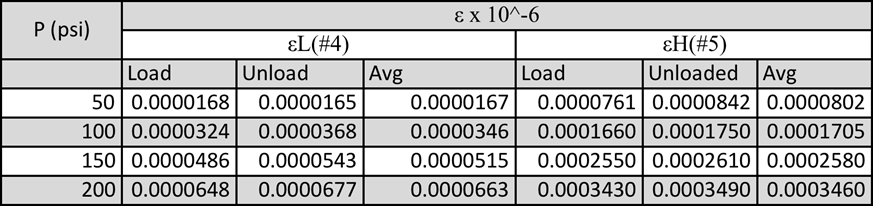
Data sets:


Findings
After conducting this experiment and evaluating the experimental Poisson’s ratio to the theoretical Poisson’s ratio you notice that the % error for this calculation is very low. With the ranger of the % error ranging from 0.2%-2.8%. Based on the low % error for Poisson’s ratio for each of the 4 different pressures which were compared, it is safe to say that the data captured during this experiment is accurate and does accurately correlate with the theoretical data and calculations.
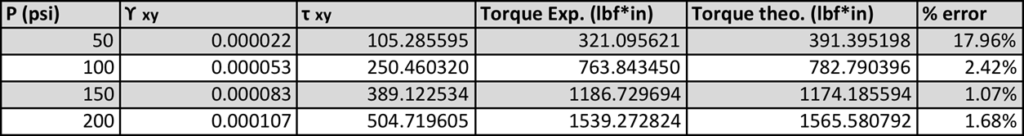
The second value that was computed was theoretical and experimental torque. These values just like Poisson’s ratio had a low % error also signifying a good correlation between the theory and the testing procedure. Once again this validates the data collected is accurate. The % error ranges from 1.07% error to 17.96% error. The only value, an outlier with the rest of the data, is the torque calculated at 50psi, which has a % error at 17.96% error. Some of the possible reasons for this error could be the fact that the strain gauges used are not as accurate at lower psi. Or also the pump might have not been as accurate for 50 psi as it took a lot longer to arrive at 50psi than it did any other interval with the hydraulic pump. Excluding this trial, the % errors of the data ranged from 1.07%-2.42% error, which is very good.
The final value which was calculated and compared to the theoretical value was the modulus of rigidity. These calculation were not as close as the other two but the ranger of the % errors does seem to be close together which does signify accuracy. The % error ranged from 23% error to 29.5% error. Where 50 psi had the lowest % error of 23% and 200 psi had the greatest error. It was interesting to see that as the psi was increased the greater the % error was. And this pattern was not observed on any other of the values that were calculated.
References
Experiment #6 Combines Stresses In A Pressure Vessel, Mechanical Measurements, Laboratory Procedure Department of Mechanical Engineering Widener University