Surface Tension of Liquids
Background and Theory
This laboratory experiment investigates the surface tension of different working fluids and how contamination can drastically affect surface tension. Surface tension is a result of the molecules deep within the fluid repelling each other while the molecules at the surface attract each other [1]. Introducing contaminates like detergents into the surface of fluid can considerably change the measured surface tension [1].
The objective of this experiment is to measure the surface tension of several liquids in the air with a Fisher Surface Tensiometer, Model 20.
Experimental Setup and Procedure
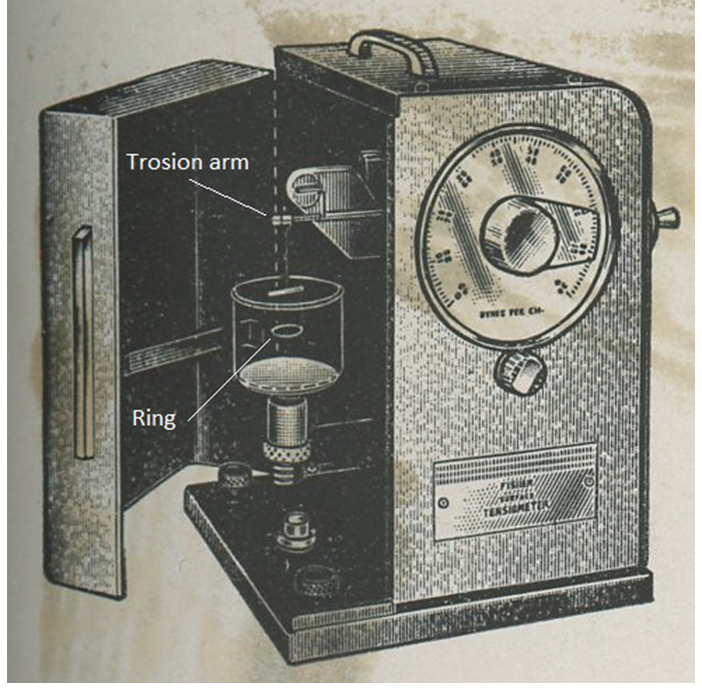
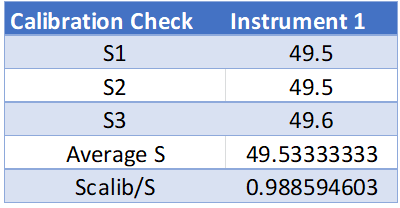
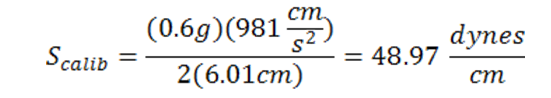
A schematic of the experimental setup used is presented in Figure 1. The first part of the experiment is to calibrate the tensiometer. This is done by hanging the ring on the torsion arm and setting the index needle equal to the line in the mirror. Next, a 600 mg weight will be hung and measured by the tensiometer. This measurement should come close to the value of the calibration equation. See Eq. 1 below for Instrument reading during calibration [dynes/cm]
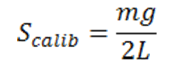
(Eq. 1)
Where m is the mass [g], g is the acceleration of gravity [cm/sec2] and L is the mean circumference of ring [cm]. Now that the machine is calibrated the correction factor must be calculated to account for measurement error. See Eq. 2 at the top of the following page.
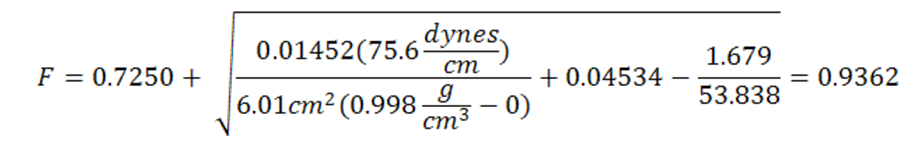
Correction factor (F):

(Eq. 2)
Dsurcrose at 20oC : 1.23 g/ cm3 [1]
Dwater at 20oC : 0.998 g/ cm3 [1]
dair at 20oC : ≈ 0 g/cm3
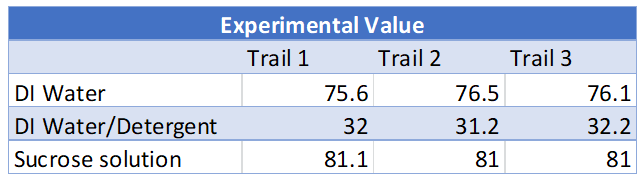
Where F is the correction factor [-]; D is the density of the lower phase [g/ cm3]; d is the density of the upper phase (air) [g/ cm3]; R/r is the ring radius to wire radius ratio and L is the mean circumference of the ring [cm]. Once the correction factor is calculated measurements can be made. The different liquids that will be tested are DI water, DI water with detergent, and a sucrose solution. Three measurements of each solution will be made. Make sure that the dish is completely cleaned and dry when changing the fluid. Once all experimental values have been recorded multiply the experimental value with the correction factor to calculate the true surface tension see Eq. 3.
True surface tension (Strue_value):
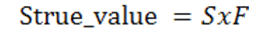
(Eq. 3)
Where F is the correction factor [-] and S is the apparent/experimental value of surface tension [dynes/cm]
Experimental Results
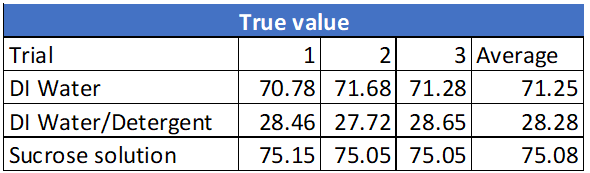
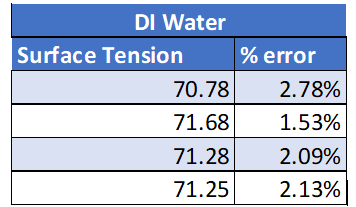
All experimental results are presented in the Appendix. The results from this experiment verify that the initial prediction was correct. See table 1: True values for surface tension.
These experimental values were then compared to the theoretical values and % errors were calculated for each trial. The theoretical values for each solution tested are listed below [3].
DI Water 72.8 dynes/cm
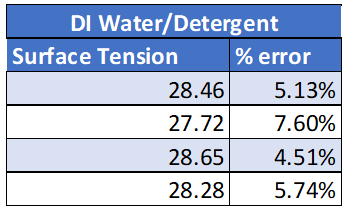
DI Water / Detergent 30 dynes/cm
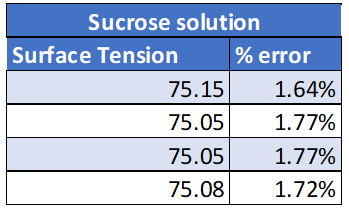
Sucrose 76.4 dynes/cm
Calculations for the % error can be found in the appendix. All % errors for this experiment were very low. The higher % error calculated was for DI water with detergent of 7.6% error which is still good. All surface tension values were then graphed. What is noticed from this graph is that the surface tension values all stay very consistent. This shows reliable data as the data is not all over the place and there is little variation between trials.
See Figure 2: Surface Tension.

Discussion
Examining the data in Figure 2 it is noticeable that the measured surface tension is consistency between each trial as each solution creates a horizontal line. The highest standard deviation calculated was 0.49 for DI water with detergent. While the standard deviation calculated for sucrose was only 0.0573. This very low standard deviation also confirms that there is a very little fluctuation between each trial. See the Appendix for a full list of all standard deviations calculated.
Combining that with the low % error, it is safe to say there is a good correlation between experimental values and theoretical values. The reason that the DI water with detergent has the highest % error and the standard deviation is that the density was assumed to be the same as water for this experiment. This assumption was made because just one drop of detergent was added to the change in the density was assumed to be negligible.
Conclusion
The most interesting outcome of this experiment is when you are testing DI water with detergent. It truly is surprising to see how much of an effect one drop of detergent can have on the surface tension of water. This experiment did have a very low % error the only thing that could be improved was possible the ring. As the ring was bent from prior experiments and it is no longer flat, this could have a minor effect on measurements. Other than that always make sure to have a clean and dry dish and any contamination can drastically alter your results.
References
- F. M. White, Fluid Mechanics 5th edition, McGraw Hill, 2003
- Scientific.Industries,.2014,.http://www.wikiscales.com/articles/comapact-new-fisher-tesnsiometer-brings-exceptional-convenience-to-measurements-of-this-phenomenon/
- University of Sydney. Surface tension http://www.physics.usyd.edu.au/teach_res/ jp/fluids/surface.pdf
Appendix
Experimental Results

Sample Calculations:
Instrument reading during calibration (Scalib):
Correction factor (F):
True surface tension (Strue_value):

% error:

Standard Deviation (σ):