Colligative Properties
A suspect has been apprehended who is believed to have taken part of a murder. A white crystalline substance has been seized from his house. The suspect is claiming it to be sugar. After careful analysis and experimentation with the substances colligative properties I have concluded that this is in fact sugar and the suspect is innocent.
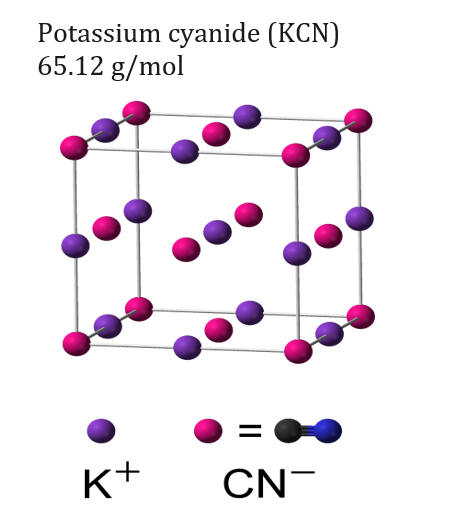
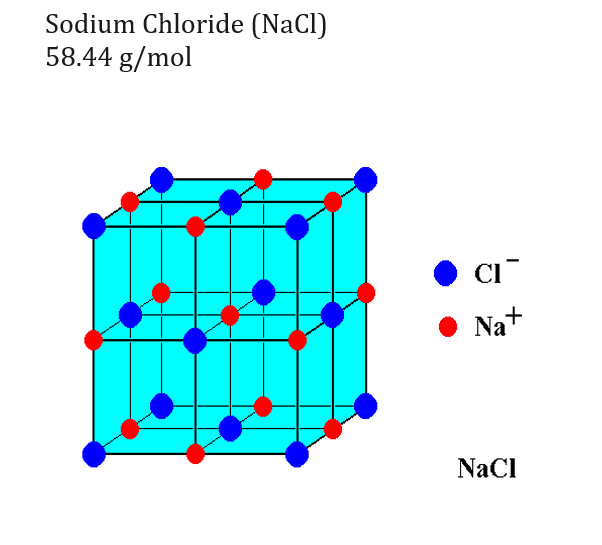
For this experiment salt was used instead of potassium cyanide. The reason that we were able to use salt was because the similarity in the molecular structure as well as molecular weight and similar properties when dissolving in water (both break down into 2 ions because of ionic bonds).
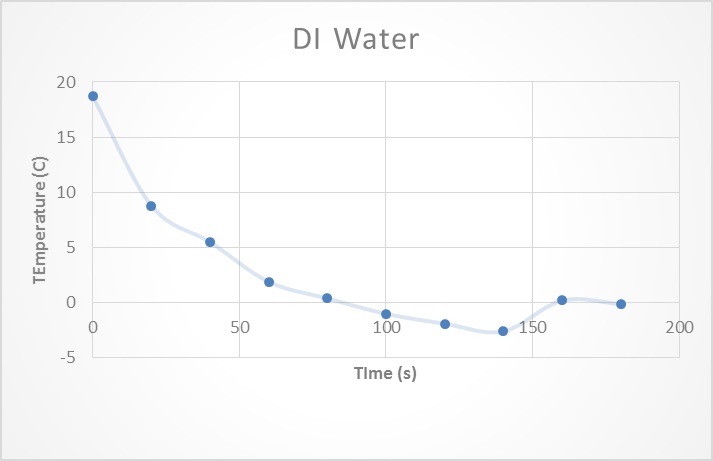
To begin this experiment DI water was tested and a temperature vs time graph was plotted. This was to take into account the error from the thermometer that was being used. The known freezing point for water is 0 o C. The experimental freezing point found for this experiment was -0.1o C. This instrument error was then taken into account during the all of the following trials. See Figure 1: DI water at the top of the following page.
Next Sodium Chloride was tested. Sodium Chloride was mixed with some DI water to come up with a 2% (M/V) solution. Then two trials were conducted to determine the effect that salt had on the freezing point of the water. The temperature vs time graph was then plotted. Something that is visible from the graph is that temperature of the solution dips down below the theoretical freezing point before coming back up and leveling off. See figure 2: Sodium Chloride.
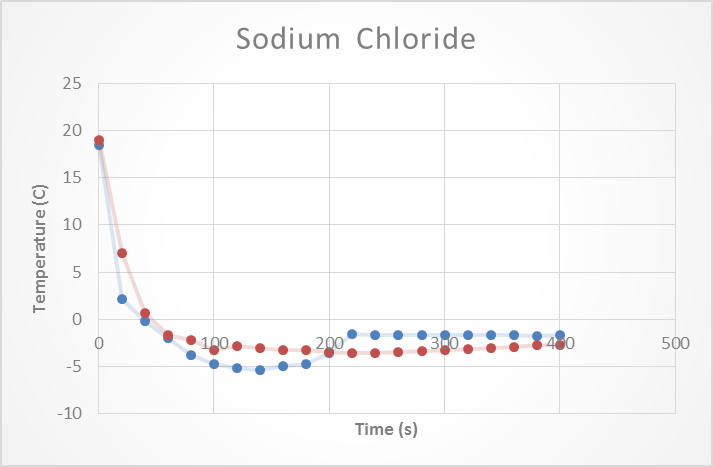
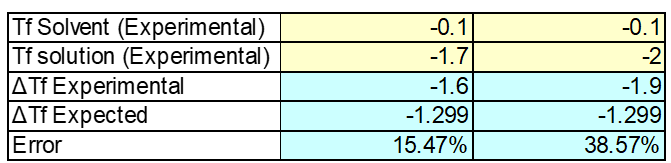
As expected adding an impurity to the water caused the freezing point of the water to decrease. The theoretical freezing point was -1.3oC but the experimental freezing points ranged from -1.7 to -2. Taking into account the error due to the thermometer the experimental freezing point was still lower than what was expected. The % errors for this test ranged from 23-46% error, which is rather high. See Table 1: Sodium Chloride below.
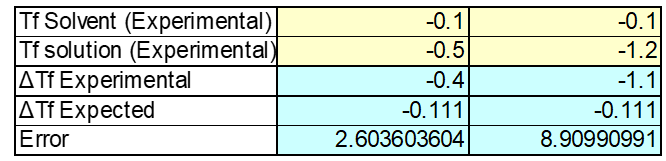
The properties of the sucrose make it difficult to really measure a change in temperature. The expected freezing point for this solution was -0.1oC. But after conducting this experimental freezing point was found ranging from -0.4 to -1.1 oC. The second trial seems to be an outlier as the freezing point is way to low to be accurate. See figure 3: Sucrose Solution below.
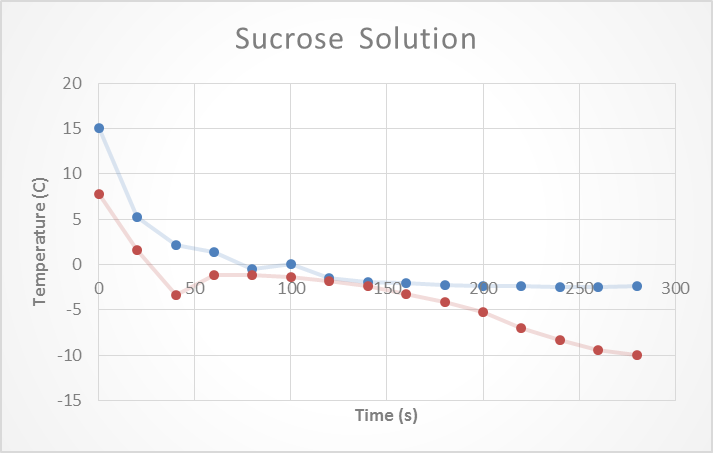
The second trail conducted for this experiment should be redone or omitted as it is way off and resembles more the results from salt. See Table 2: Sucrose Solution below.
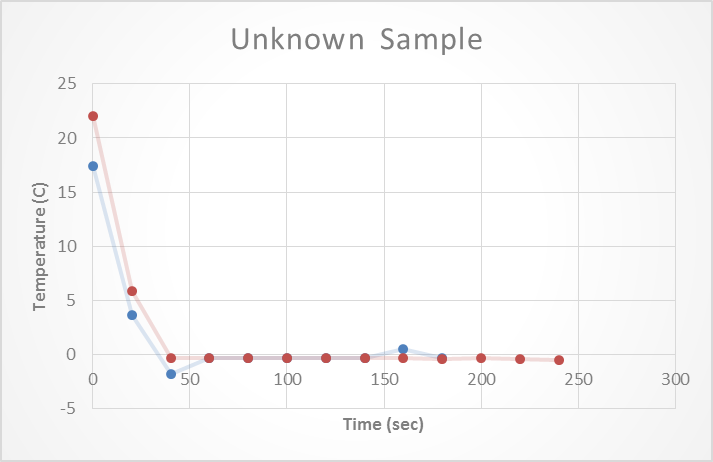
Finally the unknown sample was tested. Based on its physical properties you could see that the unknown sample had larger crystals to suggest this samples was sugar. After conducting the experiment and testing the solution the experimental freezing point was found to be -0.2oC. Based on the experimental freezing point it can be assumed that the unknown sample is sugar. Due to the fact the freezing is not low enough to be salt. See figure 4: unknown sample to see the graphical data. See Table 3: Unknown sample to see experimental data.
As a result based on the freezing point it is safe to assume the unknown is sugar, which means the suspect, is innocent and was telling the truth.

After conducting this experiment it is easy to see that there are a lot of places where this experiment could have gone wrong. Most of the error came from the thermometer and the time intervals where readings occurred. Due to the lack of equipment you either could be measuring the temperature of the solution or of the ice bath but not of both. So if during the course of this experiment the temperature of the ice bath began to rise it could have messed with your results. And there was no way that you could notice until after the experiment was complete. Another place where error could have occurred was due to how far your thermometer was in the 2% solution. If it was in all the way or if it was center or touching an edge of this test tube. There was a lot of room for error in this experiment, which was not taken into account, at the beginning of the experiment. Which could have resulted in data with higher % error then I would have liked to have measured.
Sources:
https://commons.wikimedia.org/wiki/File:Potassium-cyanide-phase-I-unit-cell-3D-balls.png

