Drag Forces on Wing Platform
Background and Theory
This laboratory investigates how the drag coefficient changes with respect to Reynolds number Cd(Re) for two wing types commonly found on aircraft, slightly swept wing and the elliptical wing. A model plane was placed in a wind tunnel which carefully controls and monitors the airflow so the forces/pressure acting on the plane can be measured. Wind tunnels are primarily used during aerodynamic analysis of a body. This analysis is done extensively in the automotive and aerospace industry, to try to minimize the drag force by making the design more aerodynamic. To calculate the coefficient of drag on each of the wings, see Eq 1.

(Eq. 1)
Where Cd is the coefficient of drag [-], Fd is the drag force [N], ρ is the density of the air [kg/m3], and A is the projected area [m2]. The Boeing – 747 has a swept wing type and it can reach a top speed of 614 mph [2]. On the other hand the Cessna – 150 has a more elliptical wing type and can reach a top speed of 124 mph [3]. Based off these two known aircraft wing types it was predicted that the swept wing would have a lower coefficient of drag, as a result; resulting in a more aerodynamic wing type.
Experimental Setup and Procedure
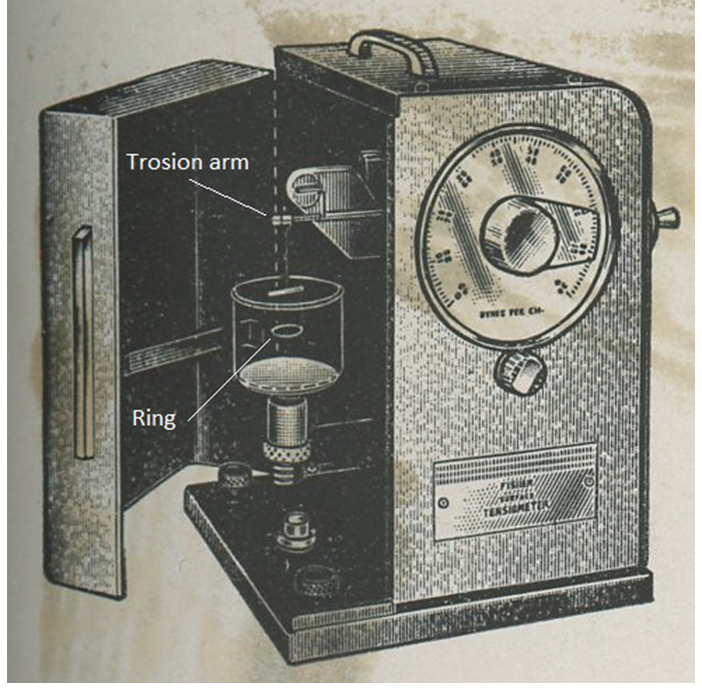
During the first part of this experiment, the wind speed was measured using a Pitot tube. The Pitot tube uses the difference in the static and total pressure to determine the wind speed. Schematic of the experimental setup used is presented in Figure 1: Pitot – static tube.
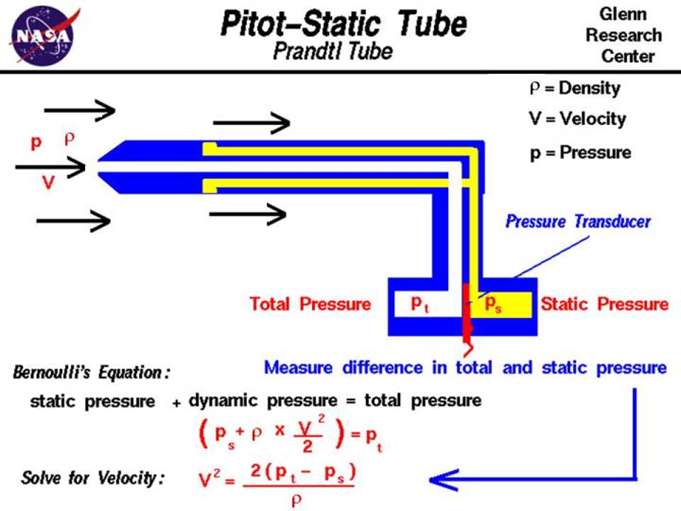
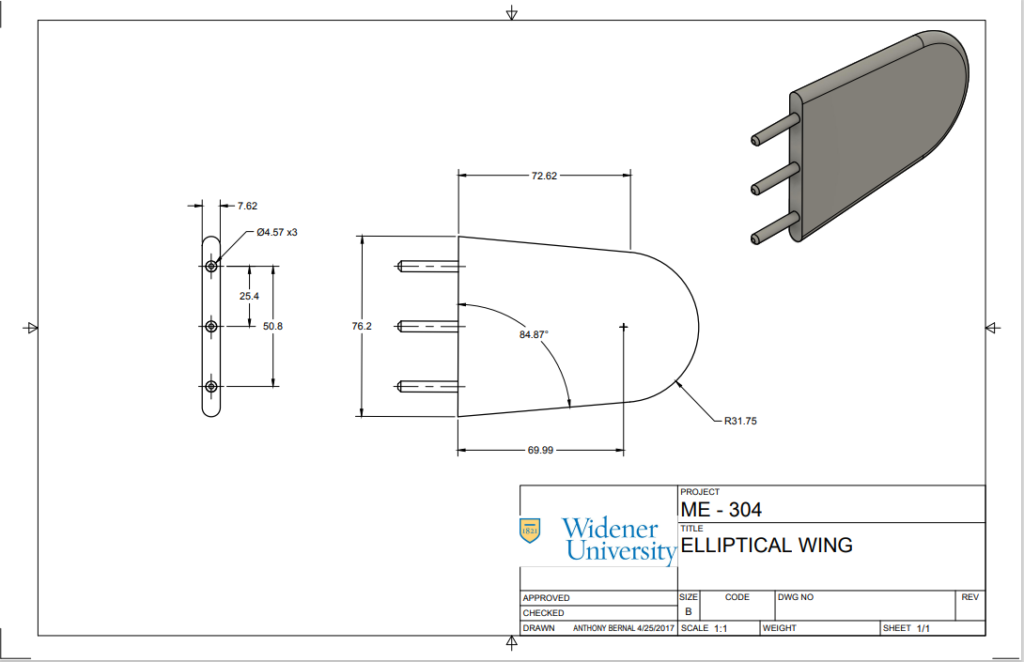
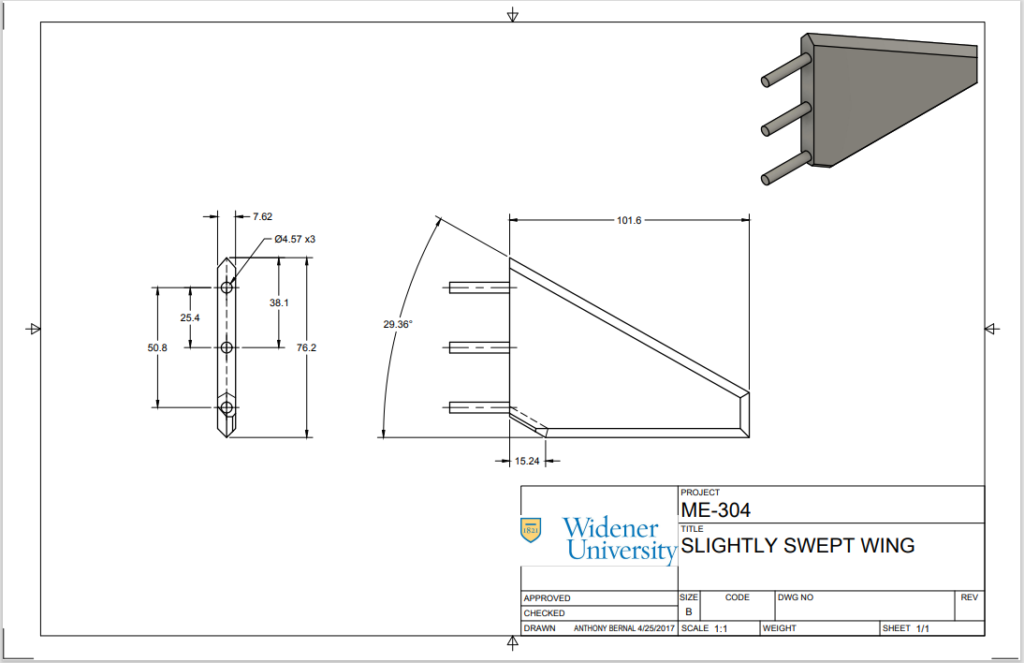
The purpose of using a Pitot – static tube is to verify the wind speed measurements from the wind tunnel to verify accurate readings. After verifying the accuracy of the wind tunnel the fuselage was placed in the wind tunnel and the second part of the experiment was performed. The drag force and lift were measured in wind tunnel power from 10% max power to 100% power in increments of 10. The fuselage was a kept constant during this experiment, so the difference in drag force would be due to the different wing types only. Afterward, the experiment was performed with both the elliptical and the slightly swept wing. The data acquired was recorded. See figure 2: elliptical/swept wing setup at the top of the following page.
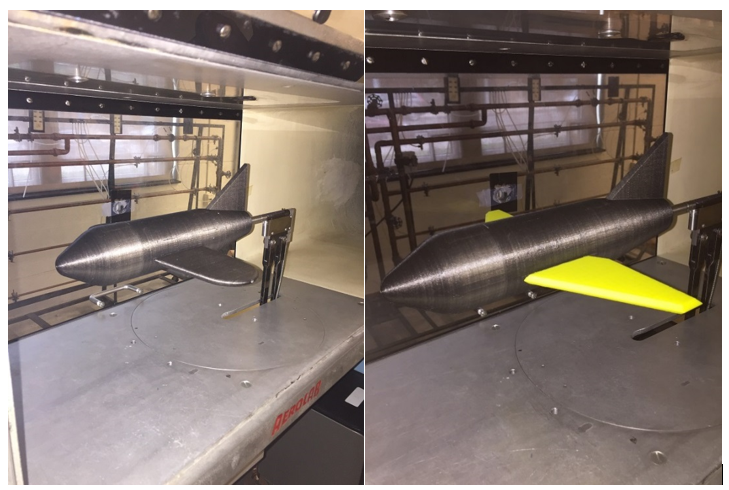
(Elliptical Left, Swept wing Right)
The Reynolds Number is an important nondimensional number in fluid dynamics, which is a measure of the internal forces to the viscous forces. For exterior flow Reynolds Number less than 500,000 are considers Laminar while at Reynolds Number greater than 500,000 the flow is considered to be turbulent. Based on the wind velocity inside the wind tunnel, the Reynolds number was calculated for each of the data points see Eq. 2.
(Eq. 2)
Where Re # is the Reynolds Number[-]. ρ is the density of air[kg/ m3], the known density of air at sea level and 20oC is ρair = 1.225 kg/ m3 [4]. V is the average velocity of the fluid[m/s]. L is the characteristic length used [m]. μ is the dynamic viscosity of the fluid (N s/m2). The fluid is air so: μair at 20oC is 1.837 x 10⁻⁵ N s/m2 [1].
Experimental Results
The first part the experiment is to use the Pitot tube to check the wind tunnels accuracy of wind speed. The Pitot tube was used at multiple wind speeds and the results comparing the Pitot tube and the tunnel wind speed is represented in Table 1.
| Dynamic Pressure (inH2O) | V Pitot Tube (mph) | V Wind Tunnel (mph) | % Diff |
| 0.03 | 7.8 | 8.7 | 11.40 |
| 0.13 | 16.3 | 21 | 29.18 |
| 0.45 | 30.2 | 35 | 15.72 |
| 0.95 | 43.9 | 47.9 | 9.00 |
| 1.64 | 57.7 | 61 | 5.64 |
| 2.58 | 72.4 | 74.1 | 2.32 |
| 3.54 | 84.8 | 87.9 | 3.62 |
| 4.79 | 98.7 | 101.4 | 2.76 |
| 6.16 | 111.9 | 114.1 | 1.96 |
| 7.45 | 123.1 | 124.8 | 1.41 |
Now the three configurations of the aircraft can be tested in the wind tunnel. The first configuration is the control configuration of just the fuselage. The fuselage was tested by measuring the axial force of the fuselage when the wind tunnel was set from 20-100%. Most aircraft fly with a small angle of attack when at cruising speed, to account for this, all configurations were testing at a 3-degree angle of attack. Table 2 shows the drag forces on the fuselage at each wind tunnel percentage.
| Wind Tunnel % | Wind Speed (m/s) | Drag Force (N) |
| 20 | 9.83 | 0.044 |
| 30 | 15.33 | 0.089 |
| 40 | 21.23 | 0.178 |
| 50 | 27.09 | 0.356 |
| 60 | 32.63 | 0.623 |
| 70 | 38.80 | 1.023 |
| 80 | 44.53 | 1.201 |
| 90 | 50.07 | 1.557 |
| 100 | 54.99 | 2.180 |
Now the Reynolds number and coefficient of drag for the fuselage at each wind speed can be determined. The Reynolds number is determined using Eq 2, using the length of the fuselage as the characteristic length (11.5 inches = 0.2921m). The coefficient of drag can be calculated at each wind speed using Eq.1. The area used in Eq.1 was the projected area of the fuselage. The largest diameter of the fuselage was 2.5 inches (0.0635m), this was used for the projected area. The Reynolds number and coefficient of drag at each wind speed can be found below in Table 3.
| Wind Tunnel % | Wind Speed (m/s) | Reynolds Number | Cd |
| 20 | 9.83 | 194427.7 | 0.237 |
| 30 | 15.33 | 303130.5 | 0.195 |
| 40 | 21.23 | 419787.1 | 0.203 |
| 50 | 27.09 | 535559.9 | 0.250 |
| 60 | 32.63 | 645146.5 | 0.301 |
| 70 | 38.80 | 767105.6 | 0.350 |
| 80 | 44.53 | 880227.2 | 0.312 |
| 90 | 50.07 | 989813.7 | 0.320 |
| 100 | 54.99 | 1087027.6 | 0.372 |
The results from Table 3 are graphed to represent how the coefficient of drag is a function of Reynolds number. This graph is displayed in Figure 3.
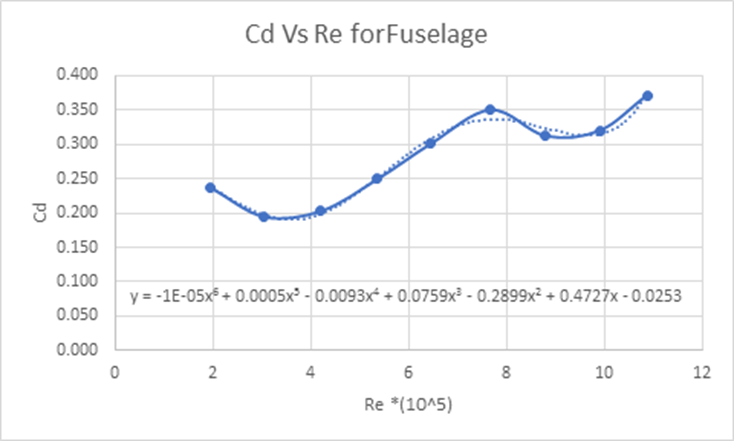
The equation in Figure 3 represents how the coefficient of drag is a function of Reynolds number. This equation will be known as Cd=f(Re). This equation will allow the coefficient of drag and the drag force of the fuselage at any speed to be determined.
The next part of the experiment was to test the full aircraft with elliptical wings inside the wind tunnel. This was also done by ranging the wind tunnel from 20-100% and having the aircraft at a 3-degree angle of attack. The results for the full elliptical winged aircraft can be seen in Table 4.
| Wind Tunnel % | Wind Speed (m/s) | Fd of Full Elliptical Aircraft (N) |
| 20 | 9.48 | 0.089 |
| 30 | 15.07 | 0.178 |
| 40 | 20.79 | 0.267 |
| 50 | 26.42 | 0.534 |
| 60 | 32.05 | 0.890 |
| 70 | 38.04 | 1.201 |
| 80 | 43.41 | 2.313 |
| 90 | 49.17 | 2.891 |
| 100 | 54.27 | 3.959 |
Since the focus of this project was how the wings affect the drag, the force from the fuselage needed to be subtracted from each measurement. Since the wind speed in the wind tunnel would fluctuate at each percentage (from 20-100%), the Cd=f(Re) equation from Figure 3 is used to find the actual drag coefficient and drag force of the fuselage at each wind speed for the elliptical winged aircraft. The wind speed at each measurement for the elliptical winged aircraft test was put into the Reynolds number for the fuselage equation. That Reynolds number was then applied to the Cd=f(Re) equation. Since the coefficient of drag for the fuselage at each elliptical wing test speed it found, Eq.1 can be used to find the amount of force the fuselage is accountable for at each wind speed. The results for the fuselage drag force at each test speed is shown in Table 5.
| Wind Speed (m/s) | Cd fuselage (Cd=f(Re)) | Fd of Fuselage using Eq.1 (N) | Fd of Full Elliptical Aircraft (N) |
| 9.48 | 0.250 | 0.043 | 0.089 |
| 15.07 | 0.194 | 0.085 | 0.178 |
| 20.79 | 0.205 | 0.172 | 0.267 |
| 26.42 | 0.237 | 0.321 | 0.534 |
| 32.05 | 0.302 | 0.603 | 0.890 |
| 38.04 | 0.344 | 0.967 | 1.201 |
| 43.41 | 0.323 | 1.179 | 2.313 |
| 49.17 | 0.312 | 1.464 | 2.891 |
| 54.27 | 0.369 | 2.106 | 3.959 |
Now the force due to the fuselage is subtracted from the drag force of the full elliptical winged aircraft. This will determine the drag force due to the elliptical wings only. The Reynolds number and coefficient of drag for the elliptical wings at each wind tunnel percentage can now be calculated using Eq.1 and Eq.2. The length of the wing was 3 inches (0.0762m) and the area was the projected area of the wings at a 3-degree angle. The Reynolds number and coefficient of drag for the elliptical wings at each wind tunnel percentage is shown below in Table 6.
| Wind Tunnel % | Wind Speed (m/s) | Fd of Elliptical Wings (N) | Reynolds Number | Cd of Elliptical |
| 20 | 9.48 | 0.045 | 48875.9 | 1.020 |
| 30 | 15.07 | 0.093 | 77694.2 | 0.822 |
| 40 | 20.79 | 0.095 | 107204.2 | 0.442 |
| 50 | 26.42 | 0.213 | 136253.1 | 0.613 |
| 60 | 32.05 | 0.287 | 165302.0 | 0.563 |
| 70 | 38.04 | 0.234 | 196195.2 | 0.326 |
| 80 | 43.41 | 1.134 | 223860.8 | 1.211 |
| 90 | 49.17 | 1.428 | 253601.3 | 1.188 |
| 100 | 54.27 | 1.853 | 279883.7 | 1.266 |
Now the final configuration of the swept back wings aircraft is tested. This was done at a 3-degree angle of attack while changing the wind tunnel from 20-100%. The results from the swept back wing test can be found in Table 7.
| Wind Tunnel % | Wind Speed (m/s) | Fd of Swept Back Winged Aircraft (N) |
| 20 | 9.61 | 0.089 |
| 30 | 15.24 | 0.178 |
| 40 | 20.92 | 0.311 |
| 50 | 26.64 | 0.578 |
| 60 | 32.32 | 0.890 |
| 70 | 38.13 | 1.334 |
| 80 | 43.85 | 1.512 |
| 90 | 49.17 | 2.091 |
| 100 | 54.76 | 3.069 |
The same procedure for finding the force due to the fuselage at each wind speed by using the Cd=f(Re) equation was used for the swept back test. The drag forces for the entire swept back winged aircraft and only for the fuselage can be found in Table 8.
| Wind Speed (m/s) | Cd fuselage (Cd=f(Re)) | Fd of Fuselage using Eq.1 (N) | Fd of Swept Back Winged Aircraft (N) |
| 9.61 | 0.245 | 0.044 | 0.089 |
| 15.24 | 0.194 | 0.087 | 0.178 |
| 20.92 | 0.206 | 0.175 | 0.311 |
| 26.64 | 0.239 | 0.329 | 0.578 |
| 32.32 | 0.305 | 0.619 | 0.890 |
| 38.13 | 0.344 | 0.972 | 1.334 |
| 43.85 | 0.320 | 1.193 | 1.512 |
| 49.17 | 0.312 | 1.464 | 2.091 |
| 54.76 | 0.371 | 2.160 | 3.069 |
Taking the force of the swept back winged aircraft and subtracting the drag force due to the fuselage will determine the force due to the wings. Using Eq.1 and Eq.2 will allow the Reynolds number and coefficient of drag for the swept wings to be calculated. The result for the swept wings is shown below in Table 9.
| Wind Tunnel % | Wind Speed (m/s) | Fd of Swept Back Wings (N) | Reynolds Number | Cd of Swept |
| 20 | 9.61 | 0.045 | 49567.5 | 1.576 |
| 30 | 15.24 | 0.090 | 78616.4 | 1.256 |
| 40 | 20.92 | 0.137 | 107895.8 | 1.009 |
| 50 | 26.64 | 0.249 | 137405.8 | 1.131 |
| 60 | 32.32 | 0.271 | 166685.2 | 0.836 |
| 70 | 38.13 | 0.363 | 196656.3 | 0.805 |
| 80 | 43.85 | 0.319 | 226166.3 | 0.536 |
| 90 | 49.17 | 0.627 | 253601.3 | 0.836 |
| 100 | 54.76 | 0.909 | 282419.7 | 0.978 |
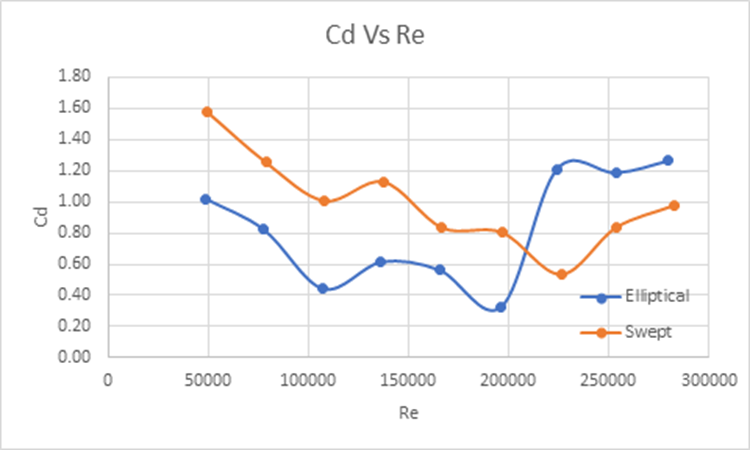
Figure 4 shows the coefficient of drag Vs Reynolds number for both wing types.
These results can be compared to Figure 5 which represents different Cd vs Re for different shaped objects.

Discussion
As seen in the experimental results, many tables were created to display the findings from the experiment. As found in table 2, when the wind speed increases, the drag force also increases. This makes sense because as you go faster in the air, more of a drag force is going to be applied to the object. Table 3 shows the comparison between wind speed, Reynold’s number, and the coefficient of drag. As the wind speed increases, Reynold’s number also increases linearly with velocity. The same thing can not be said about the coefficient of drag. Meaning some of the drag coefficients may increase or decrease while velocity increases.
After the drag force of the fuselage has been subtracted from the overall body of both aircraft configurations, it has been determined that the drag force of the swept wing is less than the drag force of the elliptical wings. The force of the swept wing reaches about 0.91 newtons whereas the force of the elliptical wings reaches about 1.85 newtons. This makes sense because the elliptical wings have more than 1.5x the projected area that the swept wings have. Yet the elliptical wings reach up to twice the amount of drag force. This shows that the swept wings have a better coefficient of drag.
In theory, this is what is supposed to happen. The swept wings are supposed to obtain less of a drag force whereas the elliptical wings are supposed to have a larger drag.
One could notice from Figure 4 that the wings had similar characteristics as the objects in Figure 5. The coefficient of drag for the wings started high and slowly decreased. This changed ones the Reynolds number started to become closer to the transition stage.
Conclusion
In conclusion, it is clear that the swept wings perform better at high speeds. The swept wings as seen in the tables above show a lower coefficient of drag. The swept wings would be ideal for a high-speed aircraft. At high speeds, the needed lift can easily be achieved, while an excessive amount of drag is created. Meaning high-speed aircraft try to obtain the needed lift while cutting down the drag force. The same cannot be said about slow moving aircraft. Slower moving aircraft need to obtain as much lift as they possibly can. This is one of the reasons why slower moving aircraft use large area wings. Figure 4 shows that these two states to be true. Both wings have its own purposes in the air but due to the results found above.
References
- http://www.lmnoeng.com/Flow/GasViscosity.php
- https://www.quora.com/At-what-speed-do-airliners-generally-travel-Do-they-typically-fly-at-or-near-their-top-speed-Are-any-capable-of-mach-1
- ]https://www.aopa.org/go-fly/aircraft-and-ownership/aircraft-fact-sheets/
- http://www.engineeringtoolbox.com/air-density-specific-weight-d_600.html
- http://www.flowillustrator.com/wp-content/uploads/2016/08/DragCoefficients.png
Appendix
Sample Calculations:
Pitot tube Wind Speed (m/s):

Convert (m/s) to (mph):

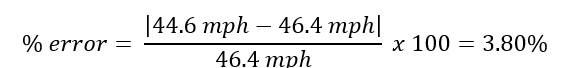
% error:
Convert (lbf) to (N):

Reynolds Number of the Wings (-):

Coefficient of drag (-):

wing design: