Impact of a Liquid Jet
Background and Theory
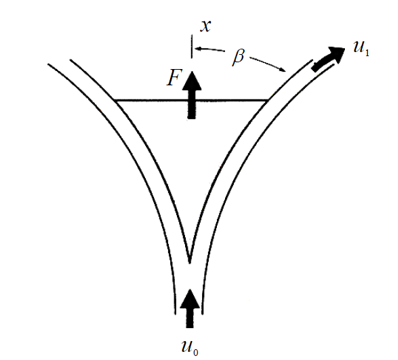
This experiment looks at how different obstructions affect the force exerted by a water jet. To obstruct the flow of fluid vanes were used. A vane as defined by Webster’s dictionary is “a thin flat or curved object that is rotated about an axis by a flow of fluid or that rotates to cause a fluid to flow or that redirects a flow of fluid” [2]. Based on the conservation of mass, the mass flow rate of the fluid striking the vane must be equal to, the mass flow rate of the fluid bouncing off the vane as long as the vane is the control volume [1]. The conservation of linear moment is also true for this experiment. The linear moment hitting the vane must be equal to the linear momentum of the fluid being redirected. See Figure 1: vane obstructing fluid flow below.
Experimental Setup and Procedure
To begin this experiment you must select the appropriate vane. Once the vane has been set up properly, turn on the pump and open the valve to allow for free fluid flow. At this point set the system’s desired volumetric flow rate. To be consistence each vane was tested at 3gpm, 4gpm and 6gpm. Afterwards refer to (Eq. 1) below to calculate the force exerted on the vane.
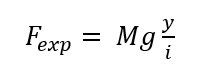
(Eq. 1)
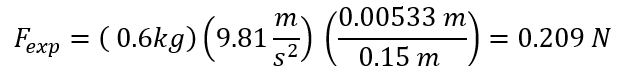
Where M is the mass of the balance weight [kg], the mass of the weight balance is a constant 0.6kg. g is gravitational acceleration [m/s2] which, is also a known value of 9.81 m/s2. y is the balance weight position [m] and l is the distance from the vane axis to the lever pivot [m] this is also a known value of 0.15m.
Once the experimental force has been calculated you need to compare this value to the theoretical value. The equation of the theoretical value varies depending on which vane is used. See Table 1: Theoretical values for F below.
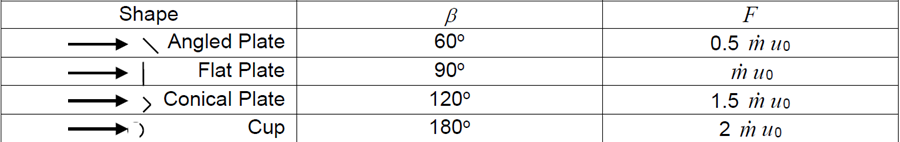
Where M_dot is the mass flow rate [kg/s] and uo is the velocity of the water striking the vane [m/s].
The final variable which will need to be calculated for this experiment is the linear momentum (Lo). See (Eq. 2) below.
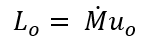
(Eq. 2)
Just as before where M_dot is the mass flow rate [kg/s] and uo is the velocity of the water striking the vane [m/s]. Once linear momentum has been calculated the relationship between the experimental force and linear momentum can be graph.
Experimental Results
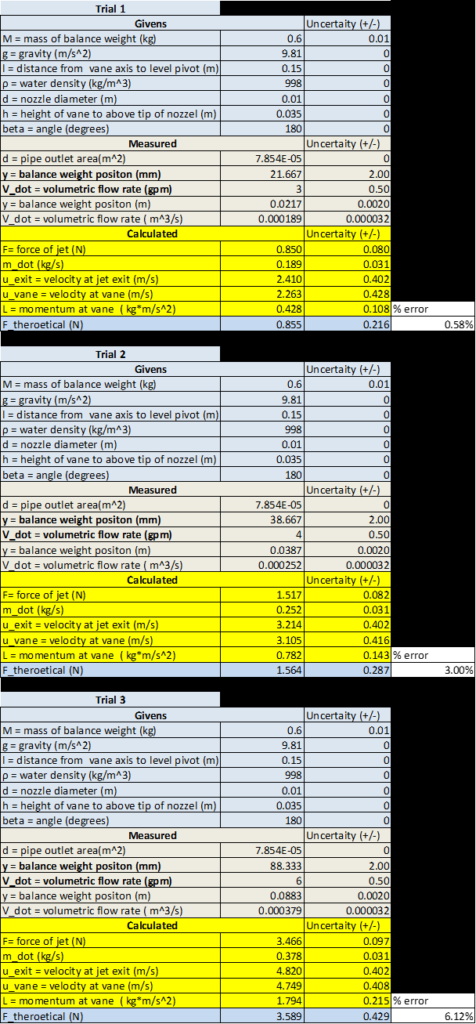
To see full list of experimental results please refer to the appendix. The experimental force exerted on the vane vs the linear momentum is listed in Table 2.
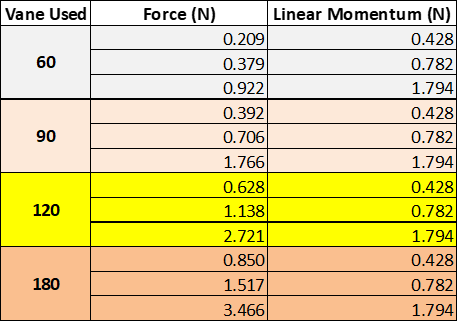
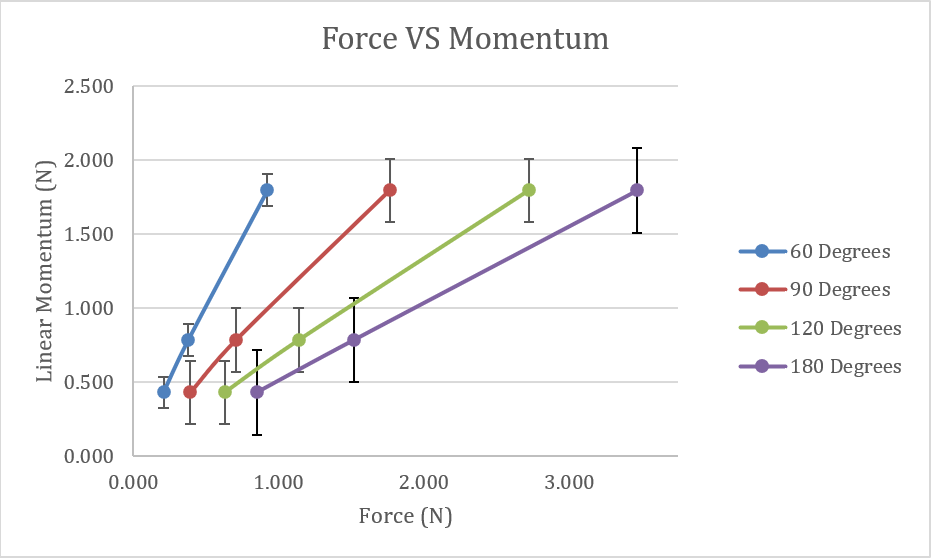
The data in Table 2 was then used to create Figure 2, which graphs the relationship between experimental force and linear momentum. See Figure 2: Experimental Force vs momentum at the top of the following page. Error bars were added to this graph to take into account the uncertainties which were carried throughout the experiment.
Discussion
The results of this experiment show that there is a linear relationship between the force exerted on the vane and the linear momentum. This makes sense because by compare the equations of the theoretical force in Table 1 to Eq. 2 you see that they are the same equation, with varying coefficients. Therefor if the experimental values are correct they should also show this linear relationship to the momentum. After preforming this experiment and comparing the experimental force to the theoretical force the % errors for this experiment ranged from 0.58% – 9.69% error. See Table 3: Experimental values for 60 degree vane below.

Regardless of which vane was used there is a similar pattern as to what is seen in table 3. There is high accuracy in the answers as each trial has very close answer with similar % errors. The vane which has the highest % error was the 90 degree vane which had trial 1 with 8.23% error and trial 3 with 9.69% error. This error could be reduced by taking more than three trials at each flow rate setting. Even though the 90 degree vane had the highest % error, the error was still not over 10% therefor this experiment did have high precision with its result.
Some of the idealizations that were made during this experiment were that h, d and l were all assumed to have a uncertainty of 0. This is assumption was made about the uncertainties because these variables were kept constant throughout the experiment and did not change.
Conclusion
After conducting this experiment is easy to see how linear momentum and the force on the vane have a linear relationship. Possible improvements to this lab could be made when measuring the balance weight position. A few mm off while reading its position can result large error in this experiment. So if a better was found to calculate this distance the errors in this experiment could be reduced further.
References
- F. M. White, Fluid Mechanics, 5th edition, , McGraw Hill, 2003
- Hacker. 2017. in Merriam-Webster.com. Retrieved February 24, 2017, from https://www.merriam-webster.com/dictionary/hacker
Appendix
Data Collected


Sample Calculations
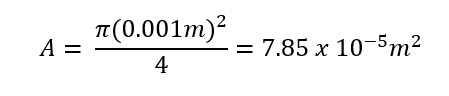
Area (A):
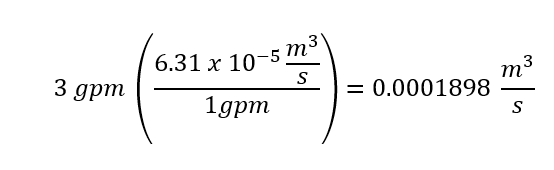
Conversion ( m3/s)
Forceexp (N):
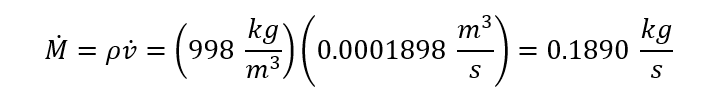
Mass Flow Rate (M_dot):
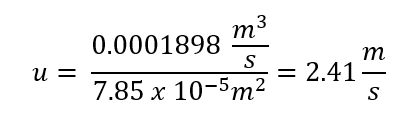
Water velocity at jet exit (u):
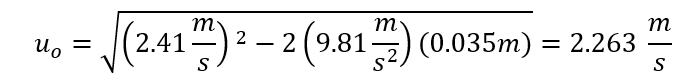
Velocity at vane (uo):
Rate of Momentum at vane entrance (Lo):

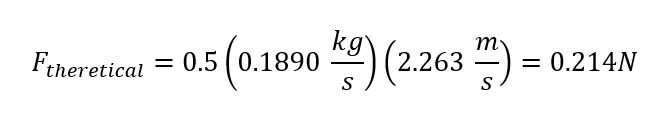
Force Theretical (FTheretical):
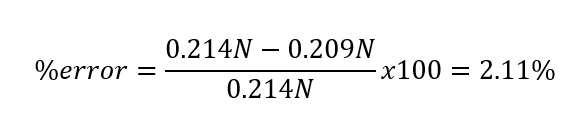
% error: