Automotive Suspension Bond Graph Simulation
Introduction:
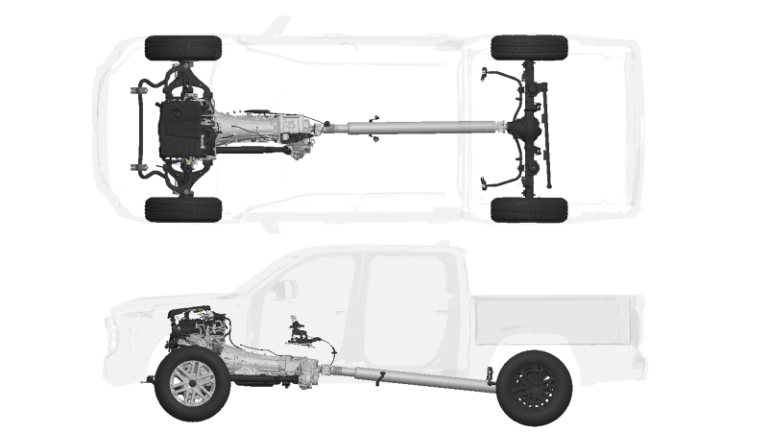
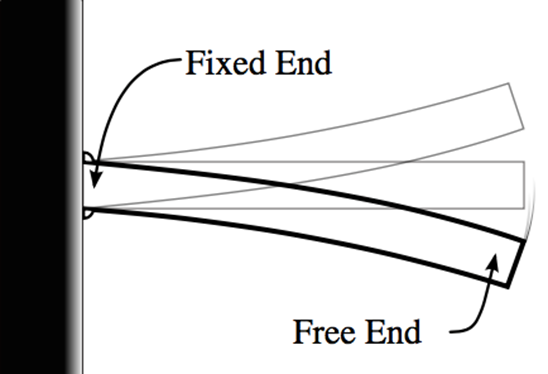
The purpose of this simulation is to model an instance when an automotive suspension is bottomed out. When a suspension system bottom outs, the springs has fully compressed and reached its maximum travel–causing the shock to crash into the bump stop. This can happen when a driver impacts a pothole at a high speed and the motion constraints are exceeded, which results in the components of the suspension impacting a solid barrier. This type of event can cause severe damages to the suspension system in a vehicle. See figure 1 below: shock and spring assembly/model.
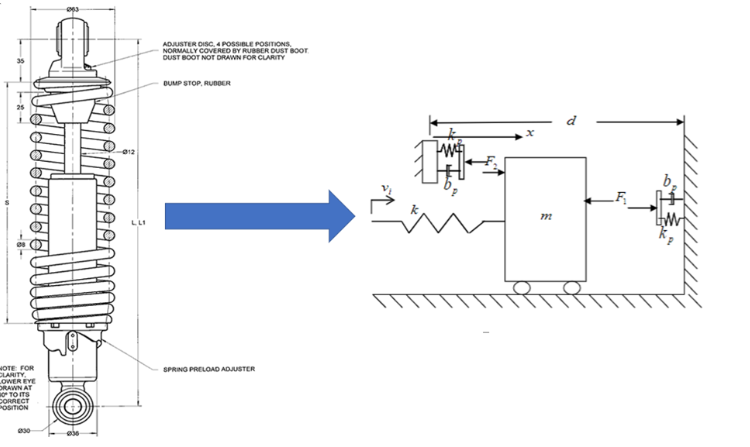
During this simulation vi(t) the harmonic input velocity into the spring will build up until the suspension is bottom out and the barriers are struck causing some deformation in the system. Each barrier is modeled as a stiff spring (kp) and stiff dampener(bp) system. The spring constant (kp) of the barrier will be varied to determine the effects on the deformation at the barrier. During the second part of the experiment the dampening ratio and input/natural frequency will be varied to determine if the mass still impacts the barriers and the amount of deformation on these two barriers. Any deformation above 7mm (.007m) was deemed to be to large.
Analysis:
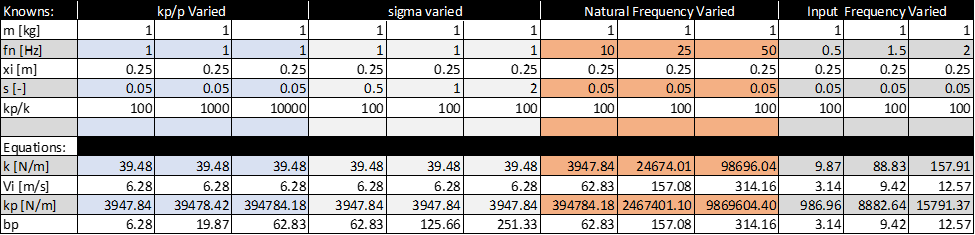
To simplify the analysis all the parameters for the 4 different scenarios were recorded in the table 1: list of parameters which can be seen below. The output from this excel was then used to input/update the parameters of 20sim and the graphical model was run to determine the effect of each variable to the system. To see graphs for each of the 4 scenarios please refer to appendix at the end of this report or see attached PowerPoint File: Project 2.
To solve this problem, a graphical approach was taken, the bond graph which was constructed can be seen at the top of the following page figure 1: Bond Graph. Since the initial force which was applied to the system was a sinusoidal function, I selected the cosine wave generator source as the input block. The code was then adapted to the specific problem, the final code can be seen in bond graph or in the attached 20sims file. That source block was connected to a zero junction which branches off to the spring (capacitor element, C) with stiffness k [N/m]. The 1 junction in the center of the graph is used to connect the mass (inertial element, I) to the system. Between the 1 and I, I placed a “q” and “f” sensor. The f sensor is used to output the velocity of the mass, the q sensor is used to determine the displacement of the mass. The mass displacement is then used as inputs to the barrier spring (kp) and barrier dampener (bp). The input was required to be able to determine the force and displacement which the barriers are subject to.
To branch off the signal from the q sensor to the various other elements, a splitter was used. An additional port had to be added to the respective C and R elements, which correspond to the left and right barrier. The code for both the C and R elements was modified accordingly to enable the program to only apply a force to the barrier if the position of the mass was greater than or lower than a certain value. An assumption made during this analysis was that the deflection in the spring and damper were equivalent, as a result only the deflection on the Cp element was calculated and graphed (RightDisp/ LeftDisp).

Results:
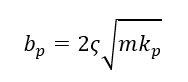
For the first part of this project, the kp/k value was varied from 100 -10,000. Since the barrier in the spring assembly was modeled as a spring/dampener system, as the value of kp/k increased, the stiffness of both the kp and bp also increased. The equations used to calculate kp and bp values can be seen below.

where x = 100,1000 &10,000
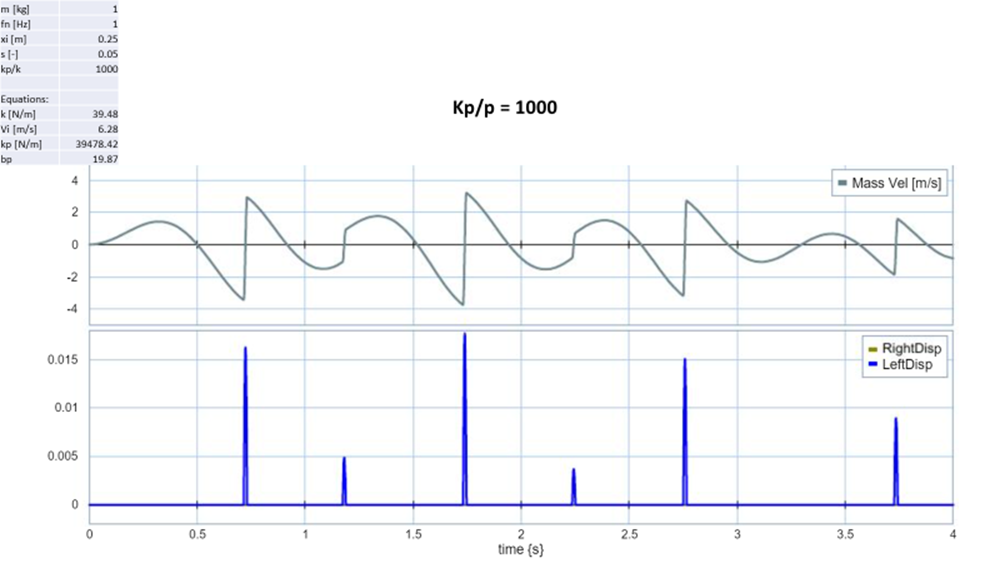
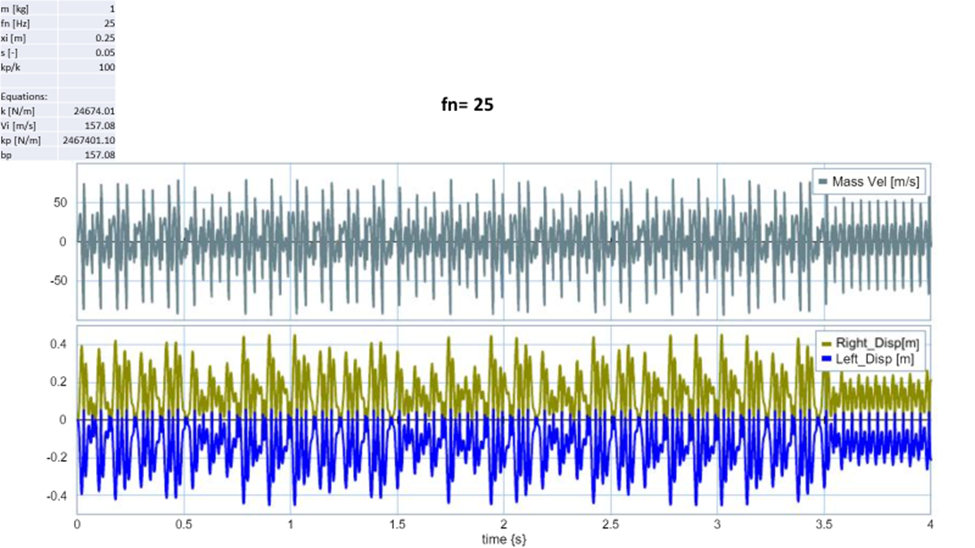
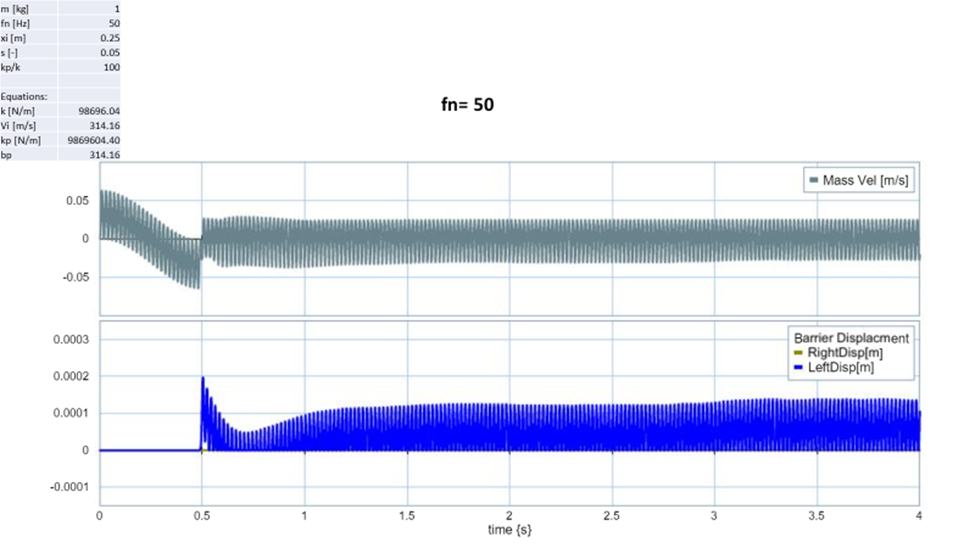
A higher kp and bp value meant the barrier the mass was impacting was going to be stronger, harder, and less pliable or willing to deform. To being the analyze I first compared the mass velocity graphs for all 3 scenarios. Each time the initial impact was around ~.75 second however, when kp/k=100 a significant reduction in velocity is noticed after the impact. The reason behind this is because the barrier absorbed much more of the kinetic energy from the mass, resulting in a deflection of 0.05m (50mm). As a result, the second impact did not happen until about 1.75 second at about half the speed of the original impact. This makes sense because during the second impact the deflection in the barrier was only .03 (30mm). Finally, there is also a impact after 2 seconds but at that time the mass has lost so much energy that the impact is barely noticeable on the graph. The mass velocity graph of kp/k = 1000 and kp/10,000 are much more similar. However, after the impact you do notice that the transition to a positive velocity is steeper. This is a good sign that the mass for kp/k =10,000 still has more energy after its initial impact. As a result, this mass is also the first to collide with the barrier on the left again. Another indication that more energy was absorbed by the barrier when kp/k = 1000 v 10,000 was because the deflection on the barrier was greater. During the first impact when kp/k =1000 the deflection on the barrier was .016m (16mm). However, the deflection on the barrier when kp/k = 10,000 was 0.005m (5mm). When comparing the deflection for all 3 graphs I noticed that kp/k = 10,000 was the only graph which impacted both barriers, the other trials only impacted the left barrier. The results from this analysis can be seen on figure 2: kp/k varied (mass velocity) and figure 3: kp/k varied (barrier displacement) graph can be seen below.


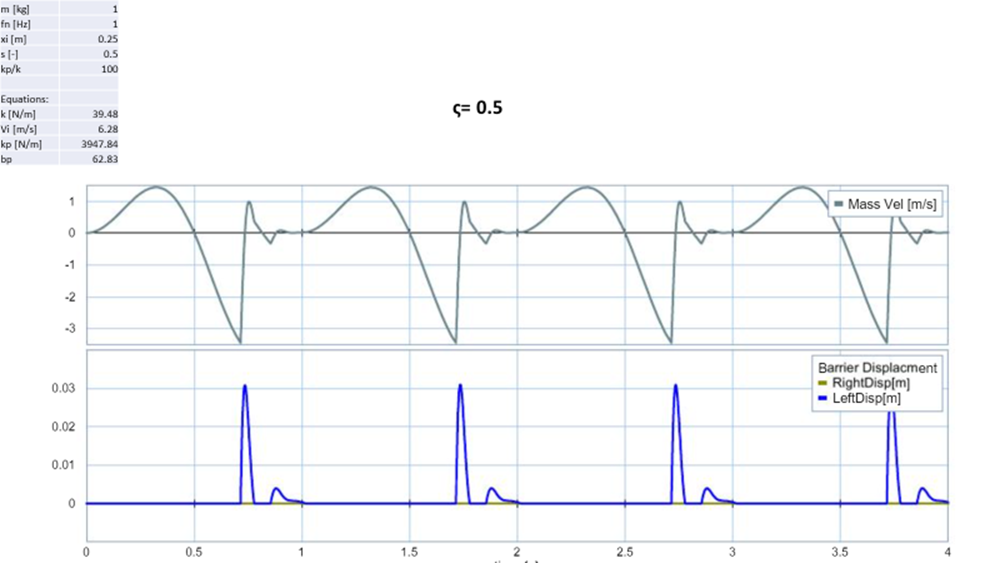
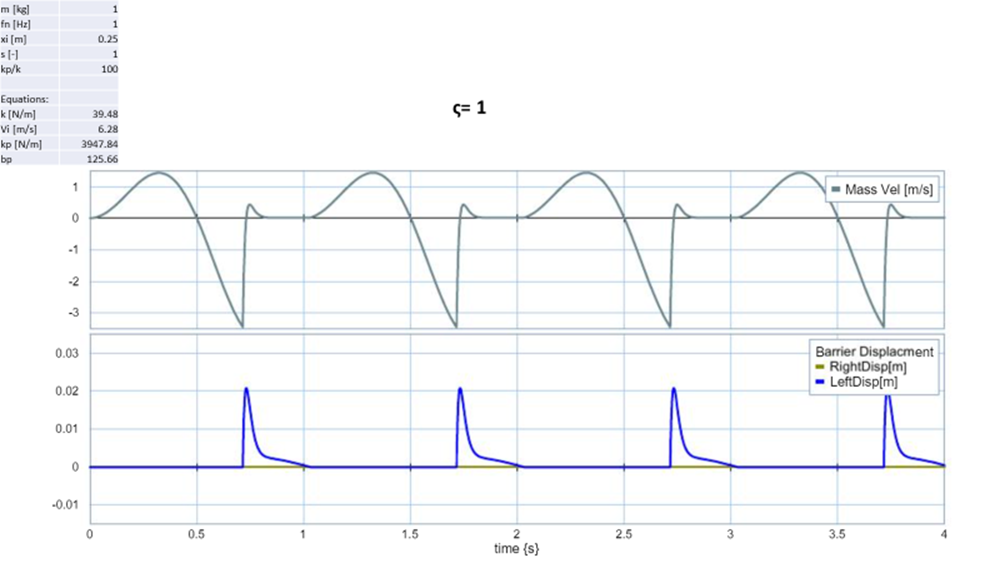
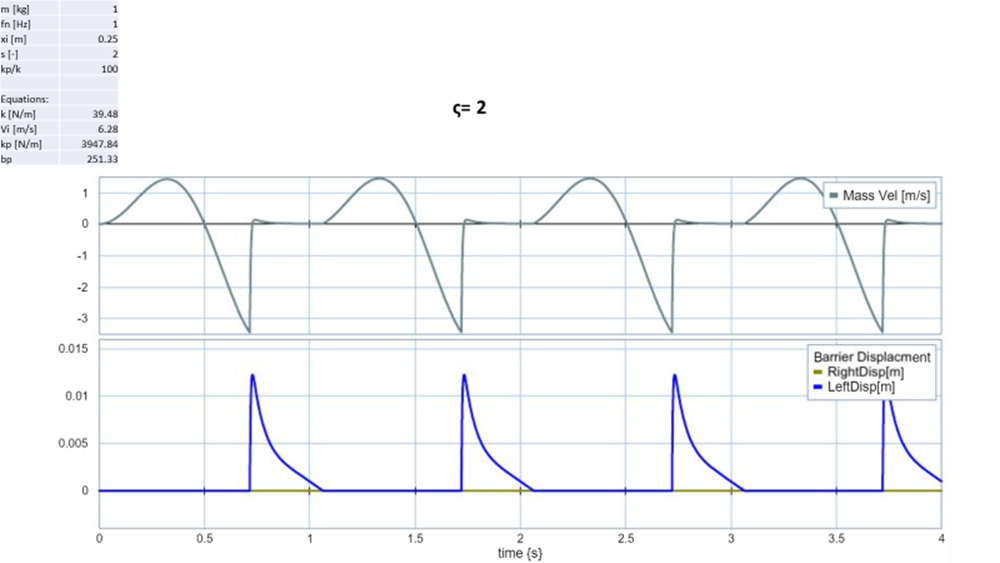
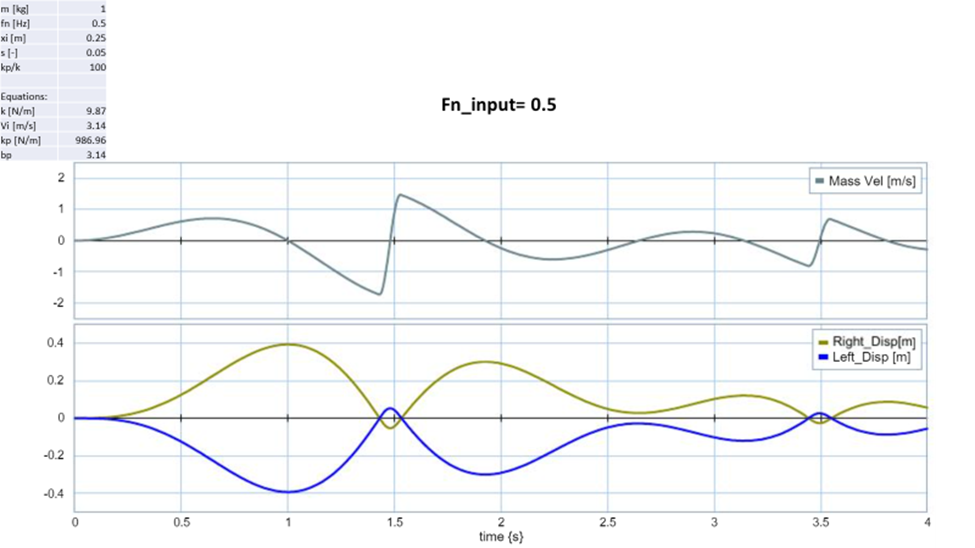
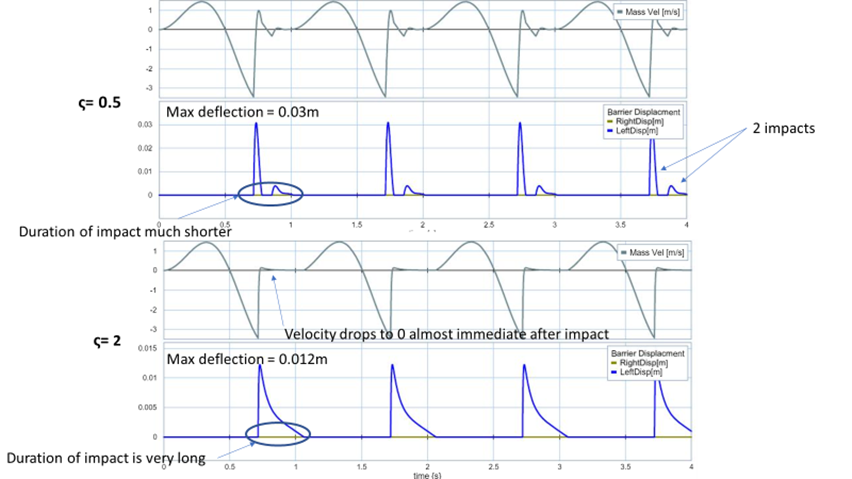
When comparing the graphs of varying the dampening coefficient (ς) the shape of the curve changes dramatically compared to the previous iteration. None of the scenarios tested below impacted the right wall, which was a result of losing significant amount of energy after initial impact. Once the ς coefficient became greater than 1, you no longer had multiple impacts to the left wall. This was a result of, the dampener absorbing more and more energy and by the time you get to ς = 2 the mass comes to a complete stop after initial impact. The deformation on the 3 graphs varied from 0.03m, 0.02m, .012m respectively. See figure 4: ς varied below.
Discussion:
Based on the criteria chosen that the deflection should not be greater than 7mm, the only trial which meet that requirement was kp/k = 10,000. This makes sense because this run had the hardest barrier so very little to no energy was absorbed by the system. When the natural frequency of the spring was changed, I also recorded very small deflection on my system however since I never see a decline in initial velocity, I believe something is wrong with my input parameters.
Conclusions:
To increase the accuracy of my model moving forwarded a second mass could be added which acts as the “tire” in the system. Instead of V initial being a continuous sinusoidal wave, which constantly supplier the model with more energy, applying a 1-time load to the “tire” would be more representative of impacting a pothole. This update would allow us to show the decay of the velocity over time. Another way to increase the accuracy of my model would be by considering any deformation which the system was subject to. Depending on the materials which the barriers are made from, after the initial impact you might notice permanent deformation. As a result, the distance the mass would have to travel to impact the barrier a second time might not be the same as the first. This level of details was ignored during my analysis and would cause a real-world test to be slightly different compared to my computer model. Finally, the spring was assumed to be on rollers, so frictional losses were not captured during my analysis. Unfortunately, due to time constraints I was not able to continue to experiment with my model.
Appendix: