Frequency Measurement and Sampling Rate
Objective
To measure the natural frequency of a vibrating cantilever beam with different lengths using different sampling rates.
Known & Assumptions:
Materials:
The materials required:
- Thin aluminum beam
- Piezo-electric sensor
- Computer with labVIEW
- Clamp with steel plates
- Calipers
Procedures:
- To begin measure the overall dimension of the cantilever beam using the calipers (width and thickness).
- Placing a steel plate above and below the aluminum beam clamp down the thin aluminum beam to the edge of a table with 25 cm (250mm) hanging off the edge
- Connect the Piezo-electric sensor to the aluminum cantilever beam.
- run LabVIEW on the computer
- once LabVIEW is recording data set the sampling rate to 200
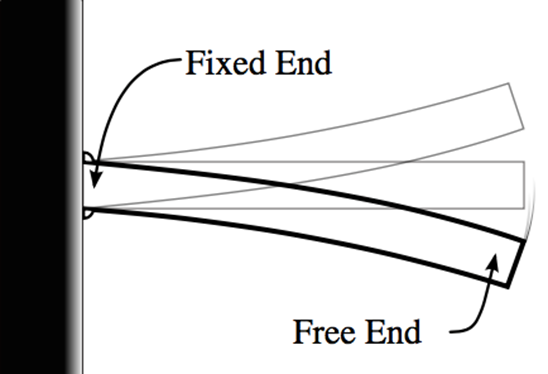
- Flick the free end of the beam and let it the cantilever beam come to a natural stop see Figure 1: cantilever beam below.
7. Repeat the experiment but each time make sure to change the sampling rate until you have repeated the experiment at all sampling rates ( 5, 10, 50, 100, 200).
8. Afterwards change the initial length to 20 cm (200mm) and repeat steps 2-7
9. Finally change the initial length to 15 cm ( 150 mm)and repeat steps 2-7
Equations/Givens
Published data charts:

Equations:
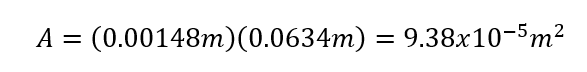
Area (A):
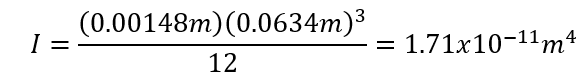
Momment of Interia(I):
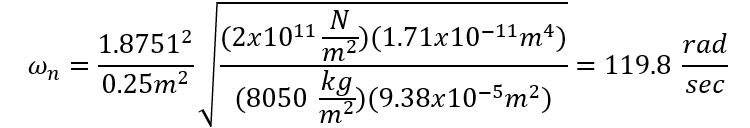
Natural Frequency (ωn):

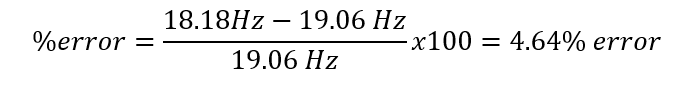
% error:
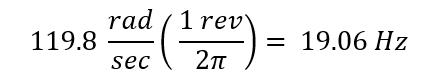
Conversion:
Example calculations:
Area (A):
Momment of Interia(I):
Natural Frequency (ωn):
% error:
Graphs:
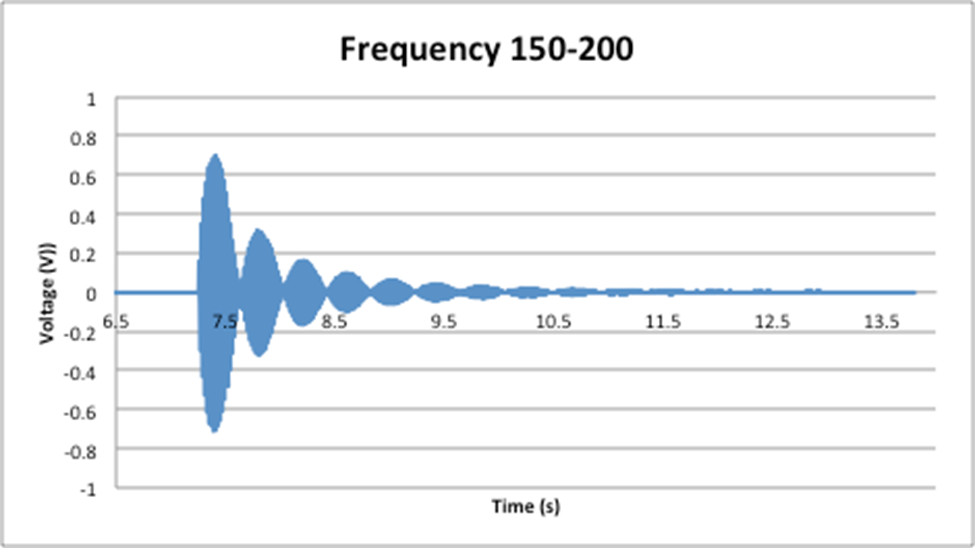


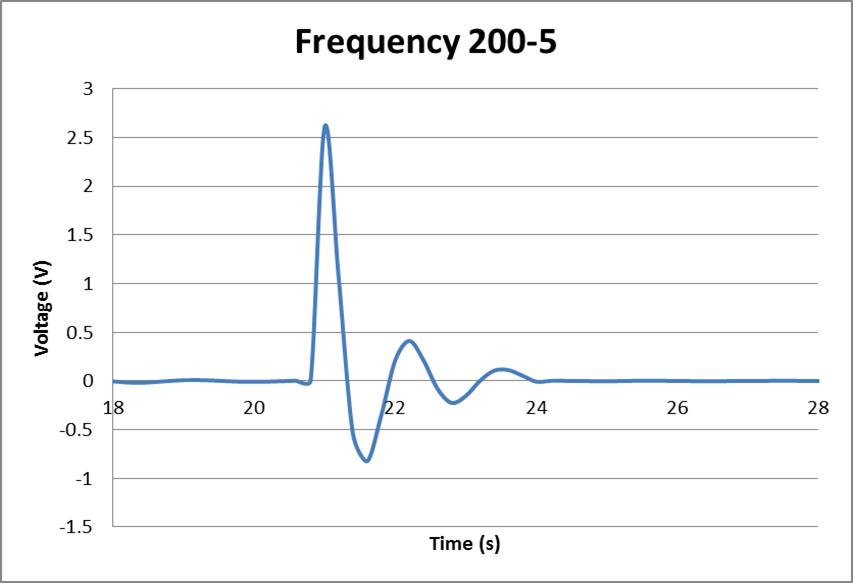


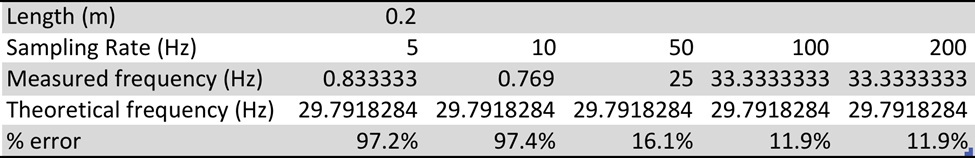
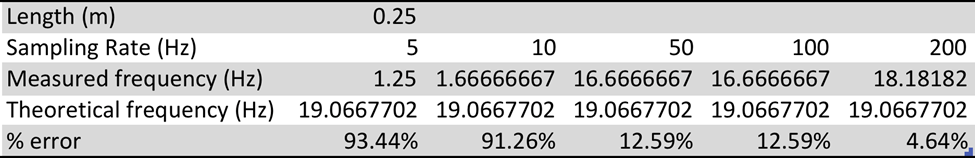
Data sets:
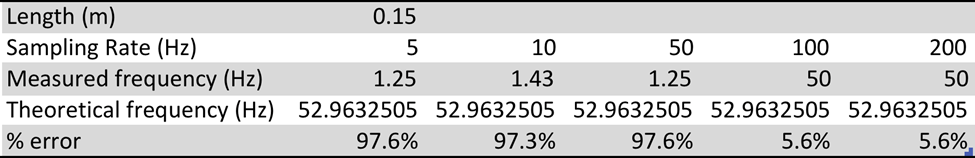
Findings:
After conducting this experiment and evaluating the experimental frequency in Hz and comparing it to the theoretical frequency in Hz you notice that there is a trend in the data. the higher the sampling rate the much more accurate the data is to the theoretical frequency. If you only look at the sampling frequency of 100 and 200 for the sampling rate the % error ranges from 12.59 – 4.64 % error. This makes sense, as the more readings you have per second the more accurate the data will be. On the other hand when looking at the sampling frequency of 5 and 10 the percent error ranges from 91.26- 97.6% error. This is a very steep percent error. And this pattern is observed thought every length, which this experiment was conducted at. Also the longer the length of the beam the lower the frequency but also the you tend to observe a lower % error for when comparing trials at the same sampling frequency. I believe the results of this experiment are good and show the importance picking a sampling rate as the results for the high sampling rates were very good.
References:
Experiment #8 Frequency Measurement and Sampling Rate, Mechanical Measurements, Laboratory Procedure Department of Mechanical Engineering Widener University