Direct Simulation of Building Vibration
Analysis:
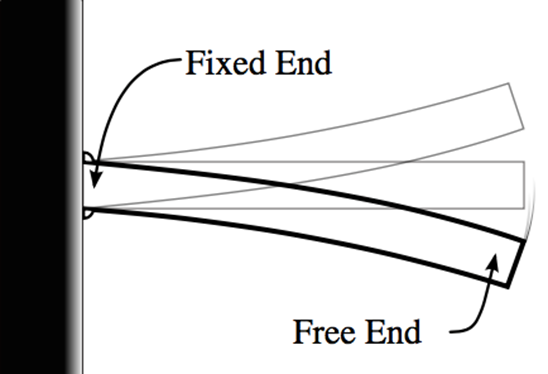
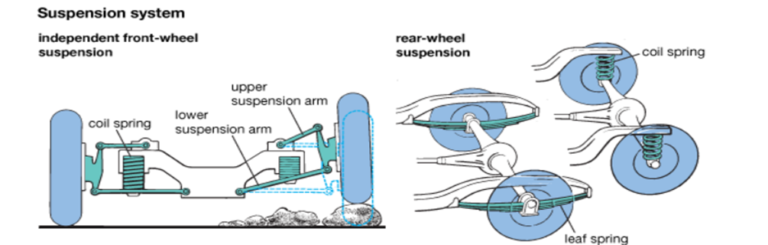
The purpose of this project was to simplify and models a 12-story building as a simple cantilever beam. The building consisted of 12 equal rigid floors. The mass of the floors was a known to be 5000 kg. Each of the floors is connected to one another with 4 I-beams. The I beams had a flexural Stiffness of a known value of 100 kN m2. Each of the I beams was 3m long. There is an applied force on the 12th floor of the building with a magnitude F12(t) = 5000sin(3t). Each floor has a damping ratio of 0.1. It is also known that the stiffness of each floor is 4 times the stiffness of a single beam. The building was modeled as a 12 degree of freedom mass-spring system. This system was modeled as a cantilever beam. It was assumed that there was no rotation of beam-ends and that the angle Φ for the cantilever equivalent was a small angle.
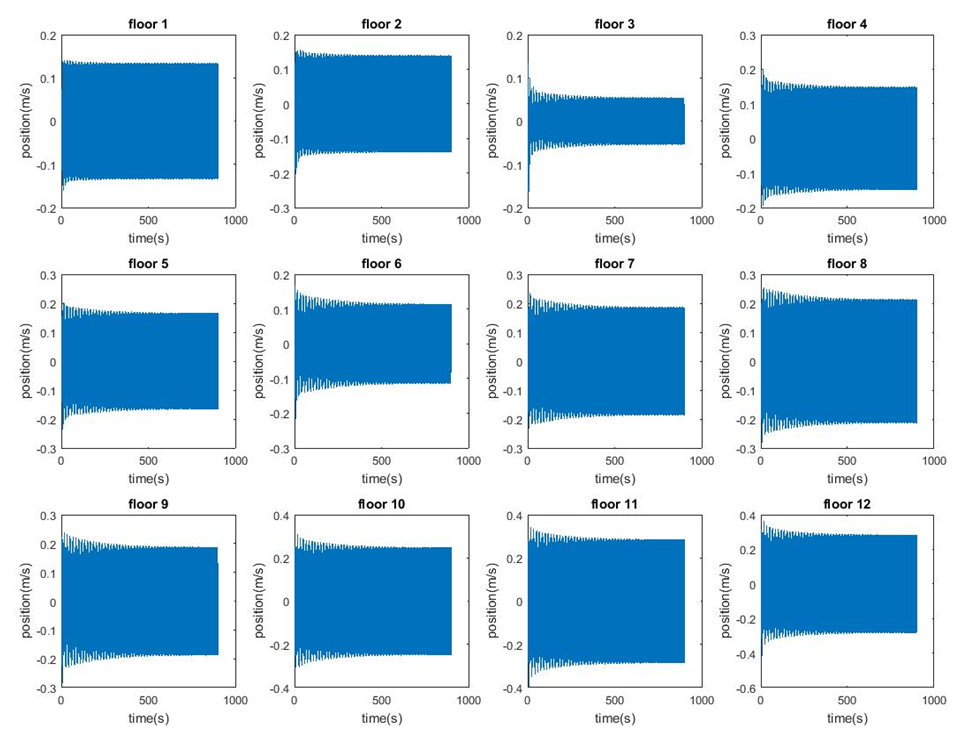
To see a copy of the detailed hand calculations please see the hand calculations section. To see a full Matlab code please sees the Matlab section. The results from these calculations demonstrate slight after 500 seconds (~600 seconds) all the floors reach a state of equilibrium where the displacement or vibrations in the building become stable. This makes sense because when you smack a cantilever beam at that initial time you get the greatest amplitude, but with each consecutive period that follows the amplitude decreases. This is what you see on all of the graphs for each of the 12 floors. Some patterns that are noticeable from this data is that floors 3- 12 seems to resemble each other more than floor 1 and 2. The first two floors seem to have less displacement due to the force, which is applied, on floor 12. This makes sense because the first and the second floor are furthest away from the applied force but also they are the closest to the ground, which is a fixed location. So having both of these floors show the least variation does make sense (both floors look like solid rectangles). With floors 3-12 the exponential decay is a lot more noticeable as in the first 100 – 200 seconds there is a noticeable drop in the amplitude. These graphs tend to resemble more a sideways tree trunk where they are wider close to the y-axis and start to narrow out and around 200 seconds start to achieve steady state. None of the floors are exactly identical as each of the floors depends on the floor above or below them. Floors 8 and 9 have the greatest displacement from any floors, while floor 3 has the least displacement. See Figure 1: Position vs Time of all Floors below.
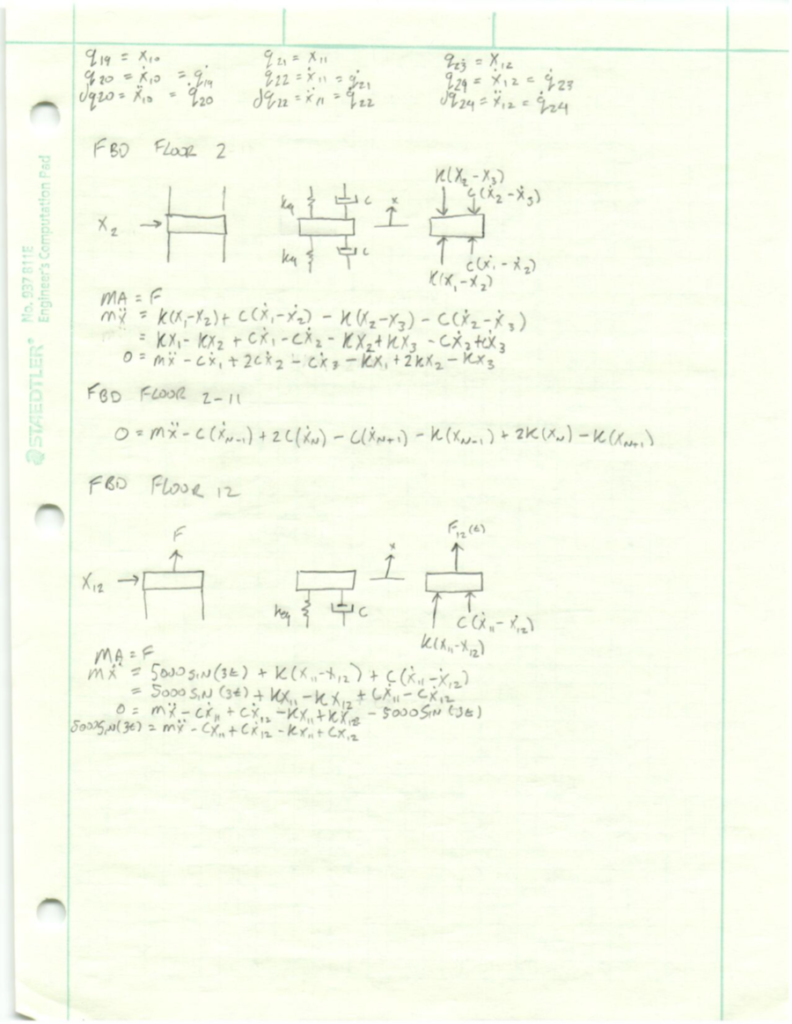
Hand Calculations: