How temperature affects material energy absorption and hardness.
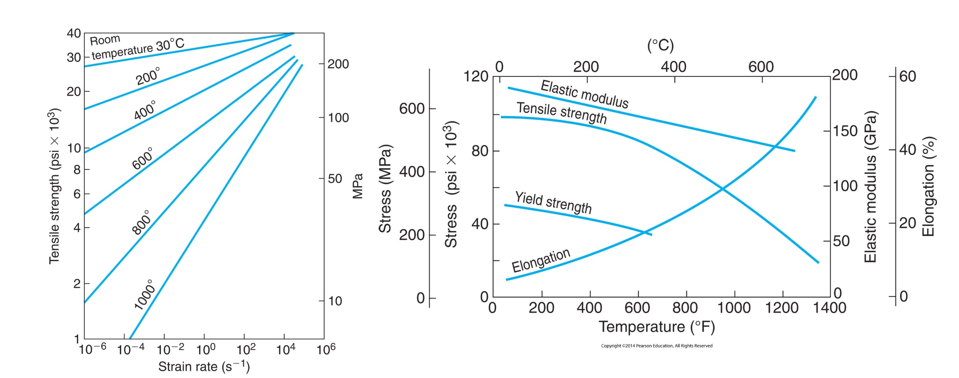
What is the relation between temperature and strain rate?
The graph below shows the effect of temperature on mechanical properties of a carbon steel. Most materials display similar temperature sensitivity for elastic modulus, yield strength, ultimate strength, and ductility. As temperature increase tensile strength, elastic modulus and yield strength of a material tends to decrease. Elongation is the only mechanical property which increases as temperature increases.
Abstract:
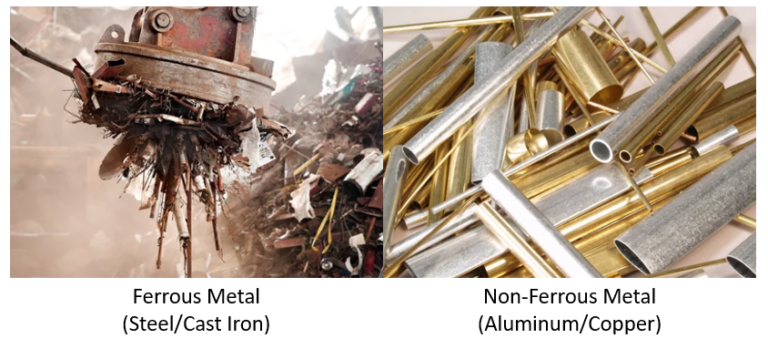
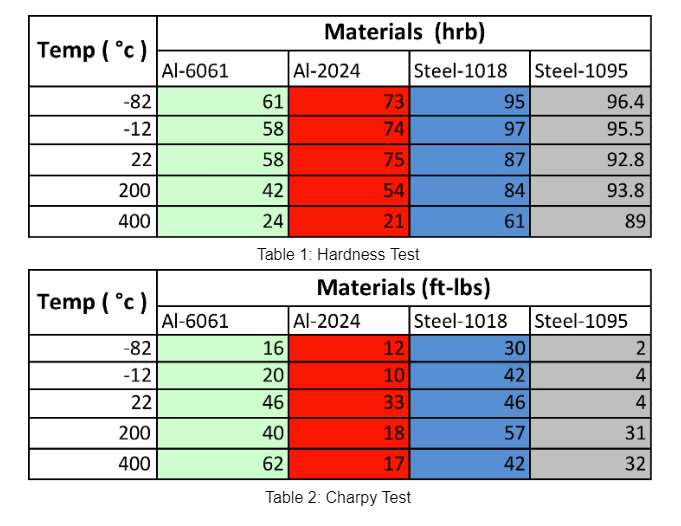
In the experiment, we wanted to see how temperature affects the impact energy of both ferrous and non-ferrous materials (steel and aluminum). Additionally, we wanted to know how the hardness of materials changed when exposed to different temperatures and if there was a correlation between the impact energy and hardness. Five Charpy specimens of each alloy were used to conduct this experiment. Two of the five were put into a freezer, two were in the oven and the last one was left out at room temperature. Then, the specimens were put into the Tinius Olsen Impact Testing Machine to measure how the change in temperature affected the energy each specimen absorbed. Using the broken sample the Charpy specimens were placed in the Wilson Brinell Hardness Tester, and the hardness of each specimen was recorded. The results showed that the hardness of specimens would increase as the temperature would decrease. As the temperature increases the Hardness of the material decreases. These results suggest that the material requires more energy to break at a higher temperature than at a colder temperature. After comparing the data an inverse relationship was found between the impact energy and the hardness of a material.

Introduction:
When a material is exposed to different temperatures, it has a certain effect on the ductility and hardness of that material. When metals are exposed to colder temperature they become more brittle and breaks easily. When exposed to hotter temperature they become more ductile and requires more force to break. Our problem is to find a relationship between the hardness of the material and the amount of energy different metal alloys will absorb before fracturing, and how these two properties are affected by different temperatures.
The objective is to see how different engineering materials respond to impact forces at varying temperatures. Then, analyze the results to see if there is any correlation between the impact energy and the hardness of a material.
This information would be useful to know and have whenever you are going to be designing something that will be operating at a different temperature other than room temperature. For example, if you are designing a sacrificial piece of metal such as a woodruff key, you want the key to break at a certain load to be able to save more valuable components. If the key is going to be subject to higher temperatures, then the amount of energy the key will absorb will increase. If this increase in temperature is not taken into account the key will not break as it is designed; which as a result could damage more costly and valuable components in the system. On the other side of things if you are designing a metal structure that will be subject to cold temperatures you need to be aware that the amount of energy that it can absorb will be reduced which could cause a safety concern. The operating temperature should be taken into account whether it would be by increasing the factor of safety or by performing a test to calculate how the hardness or the ductility of metal at the operating temperature.
Methods and Materials:
Materials:
- The specimens
- Al-6061
- Al-2024
- Steel-1018
- Steel-1095
- Tinius Olsen Impact Testing Machine
- Safety glasses
- Safety block
- Safety shield
- Oven
- Tongs
- Wilson Brinell Hardness Tester
- Freezer
- Styrofoam cooler
Experimental Procedures:
1. Before beginning the experiment put on safety glasses.
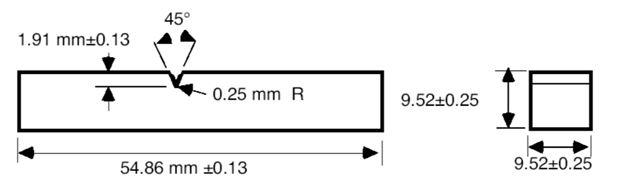
2. Verify that the specimen profile measurements meet the tolerance, which is required to perform an accurate Charpy Impact test. See Figure 1: Impact Test Specimen below.
3. Begin by putting the specimens which will be tested at high or low temperatures in the oven or freezer to get each specimen to the desired temperature. Leave specimens for a minimum of 2 hours at each temperature.
4. Raise the hammer (pendulum) all the way up until it is locked by the safeties.
5. Remove the safety block.
6. Run the Tinius Olsen Impact Testing Machine without a specimen to calibrate the machine to help account for friction error in measurement. (After every run makes sure to lock the hammer with the safeties in between runs). Perform this test 3 times and find the average frictional force.
7. Place one of the specimens which were left at room temperature so it is resting on the anvil, on the Tinius Olsen Impact Testing Machine.
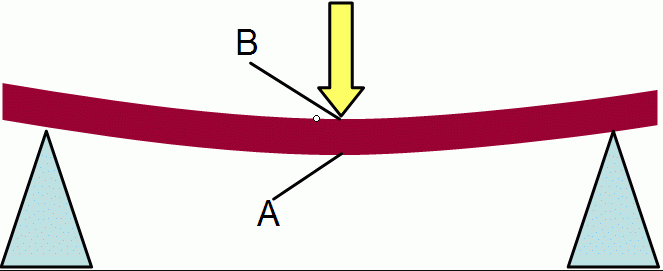
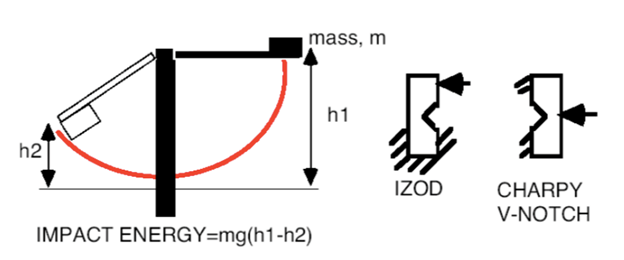
8. Make sure that the notch is centered and facing outward so the notch dictates how the specimen will fail. (Notch should be on facing away from the hammer, opposite to the impact side) See Figure 2: Impact Test setup.

9. Make sure to reset the gauge on the Tinius Olsen Impact Testing Machine (move the indicator on the scale to the end of the scale).
10. Place the safety shield to cover the Tinius Olsen Impact Testing Machine to cover and protect it from any pieces of loose metal.
11. Remove safeties so the hammer can swing down and break the specimen (do not get in the way of the hammer) see Figure 3: Impact Test pendulum below.
12. Use an electric brake to slow down the hammer until it comes to a stop.
13. Record measurement reading from Tinius Olsen Impact Test and subtract the force due to the friction of the bearings ( step 5)
14. Repeat steps 7-13 for all specimens which will be tested, when removing specimens from the oven or freezer make sure to use tongs to avoid burning yourself and also to minimize the heat transfer during setup. Place the cooled-down specimen in a styrofoam cooler when transferring it to the testing location.
15. After all specimens have been tested and recorded, plot the data.
16. For the second part of this experiment repeat step 3 but this time instead of using Charpy specimens use the broken Charpy specimen.
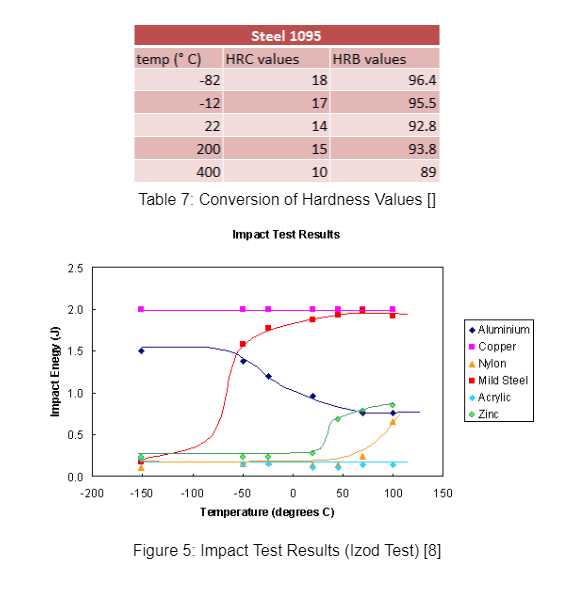
17. Start by setting up for the Rockwell B or C test depending on the specimen which will be tested. Al-6061, Al-2024, and Steel-1018 all can be tested on the B scale. Due to the higher carbon content of Steel-1095 (0.9-1% carbon content), this steel alloy is harder and it must be tested on the C scale.
- To be able to accurately compare the data converted the hardness values on the C scaleback to Brinell hardness B scale so all numbers are read on the same scale. See Figure 4: Rockwell B & C below.

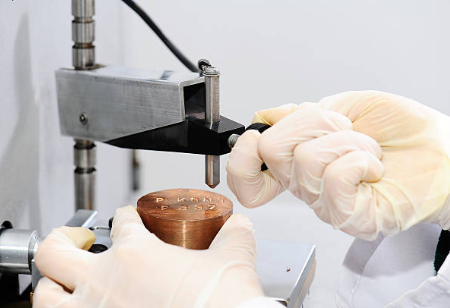
18. Begin with the room temperature specimens by placing them on Wilson Brinell Hardness Tester.
19. Make sure that the specimen is flush with the base of the hardness tester to receive an accurate test.
20. Slowly start to lower the ball adapter of the hardness tester until it is just touching the specimen which will be tested.
21. Continue to lower the ball adapter until the black arrow is aligned with the black dot on the small dial.
22. Readjust the scale of the large dial by moving it to align with the 0 on the scale until it is directly below the green arrow.
23. Press down on the front lever so the load start is applied to the specimen.
24. Once the side lever stop moving flip it and read the hardness value on the scale.
25. After all specimens have been tested record and plot the data.
Theory:
The theory behind this experiment is to find out how aluminum and steel alloys’ physical properties change and temperature change. When you are designing a product that will be subject to a wide temperature range it is important to consider how the material properties might change depending on their environment. For example, an automaker needs their vehicle to pass all the crash safety standards like side impact or roof crush regardless if the vehicle is being operated in Alaska or Arizona. By taking the temperature range into consideration and you can pick which material would be best suited for all applications/ environmental conditions of your product. Finally, the testing will allow us to see if there is any correlation between hardness and ductility by comparing the results from the hardness test to results from the impact energy absorbed by a material.
Experimental Results:
Discussion of Results:
The purpose of this experimental procedure was to determine how temperature affects the hardness and impact energy of a material specimen. Published values of the material specimens at room temperature to compare the published hardness values to the experimental hardness values. There were five metal specimens tested in this experiment in order to collect more accurate and efficient data when comparing the results involving temperature effects on impact energy and hardness. Two of the specimens were placed in a freezer, two specimens were placed in an oven/furnace and the other specimens were placed at room temperature. These different temperatures depicted how the results of the hardness test varied. The different metals obtained for this experiment consisted of steel 1018, steel 1095, aluminum 2024, and aluminum 6061. These metals are distinguished in many different ways based on their physical and experimental characteristics. By determining the impact energy, the fracture point was determined as well. Based on our experimental data and results, it was concluded that at -82 degrees Celsius and at -12 degrees Celsius, the impact energy decreased, but the hardness test increased.
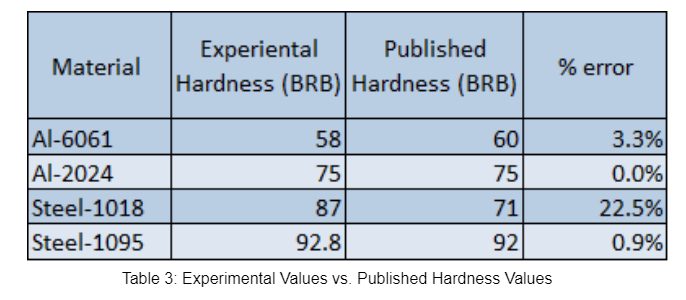
Table 3 expresses the comparison between the experimental values for hardness testing compared to the published values for hardness testing. The percent difference was calculated in order to show the percent error for each specimen. All of the specimens depicted a low percent error which had comparable ranges with each other. Steel 1018 represented the highest percent error when comparing the published values to the experimental values. Steel 1018 expressed a percent error of 22.5% which was much higher than the remaining specimens. Steel 1095 depicts a minor change in hardness values over the temperature range and is most likely due to the higher carbon content that is contained in steel carbon.
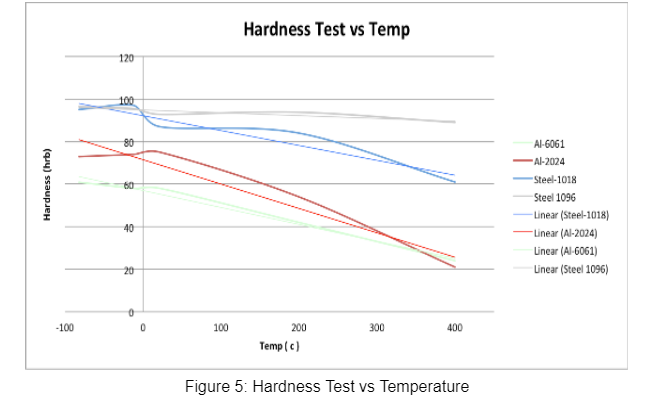
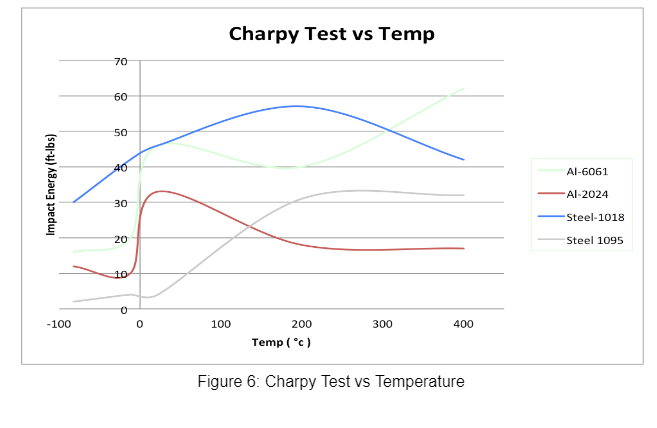
The graphs depicted in the experimental results show the correlation and relationship between temperature and impact energy or temperature and hardness. Figure 5 demonstrates the relationship between temperature and hardness. The graph shows that as the temperature values increase to become higher temperatures, the hardness values decrease at a consistent rate. Figure 6 demonstrates the relationship between temperature and impact energy. As the temperature lowers, the impact energy decreases but as the temperature becomes higher, the impact energy increases. These values on the graph demonstrate the correlation between the two factors.
Conclusion:
The purpose of this experimental procedure was to determine how temperature affects the hardness and impact energy of a material specimen. Published values of the material specimens at room temperature to compare the published hardness values to the experimental hardness values. There was little percent error calculated throughout this experiment which demonstrated fairly accurate and correlated data to the actual data. By examining the comparisons of the experimental data to the published data, a conclusion was produced. The experimental results determined and collected during this procedure proved that at colder temperatures, the impact energy decreases, and the hardness increases. The experimental results supported this statement by proving that at warmer temperatures, the impact energy increases, and the hardness decreases. These results concluded that impact energy and hardness are inversely related to each other. The experimental data collected explains the reasoning behind why colder temperatures fracture more easily than warmer temperatures. The physical characteristics of brittleness and ductility were used as comparative associations to support these statements affecting the change in temperature of the specimen materials. Brittle materials are more susceptible to fracturing and breaking than ductile materials. Ductile materials are able to be deformed without losing toughness or pliability. By comparing this information to the experimental results, it was determined that specimen materials at colder temperatures were more brittle and the specimen materials at warmer temperatures were more ductile.
Even though there were minimal sources of error for this experiment, there was still some error that may have occurred throughout the experiment. Inaccurately reading the measurements or dimensions of the specimen materials may have altered the overall findings of this experiment. Not reducing the time for transportation of specimen materials from the oven or freezer to the hardness test may have altered the temperature of the specimen to what was originally collected. By replacing the specimen material from the hardness testing machine, the temperature change from high to low temperatures may have also altered the overall temperature of the specimen by transferring the temperature from the base of the hardness testing machine to the specimen itself when placed onto the machine. Due to the lack of availability of Charpy specimens, only one trial could be tested for each specimen. This determined a minimal value impact on energy tests of specimen materials. By not testing more Charpy specimens, the impact test results were not fully comparable with other experimental results and made it not possible to calculate the standard deviation and the mean value of each Charpy specimen.
Some recommendations to improve the quality of the experimental procedure would include obtaining more Charpy specimens to test multiple trials in order to gain more precise and accurate results. More recommendations include adjusting the impact energy testing machine to the correct angle of position to determine the correct impact energy and force. Determining a way to transport the specimen materials from the oven and the freezer to the hardness testing machine can reduce the alteration of temperature by limiting the time lapse between the two devices.
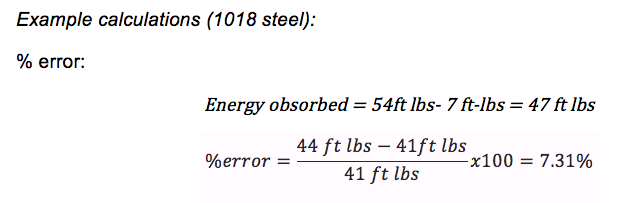
Appendix A: Sample Calculations
Appendix B: Raw Data
Appendix C: References
- “Aluminum 6061-T6; 6061-T651.” Aluminum 6061-T6; 6061-T651. N.p., n.d. Web. 05 Dec. 2016.
- “Engineering ToolBox.” Engineering ToolBox. N.p., n.d. Web. 05 Dec. 2016.
- Experiment #3 Charpy Impact, Mechanical Measurements, Laboratory Procedure Department of Mechanical Engineering Widener University
- Kopeliovich, D., Hardness test methods. substech N.p., n.d. Web. 08 Dec. 2016.
- Dempsey, Jock (2002). Hardness Conversion Table. Retrived from http://www.anvilfire.com/FAQs/hardness.htm
- Mechanics of Materials, F.R. Beer, E.R. Johnson, J.t. DeWolf, and D.F. Mazurek, McGraw Hill, Seventh Edition, 2015.
- Morrow H. , Kokernak, R. person’s statics and strength of materials 7th edition, 2010
- Rae, C. The Ductile-Brittle Transition. The University of Cambridge.N.p., n.d. Web. 08 Dec. 2016.