Performance Characteristics of a Centrifugal Pump
Background and Theory
This experiment attempts to determine how volumetric flow rate effects changes in head, shaft power and the efficiency of the pump. To simplify this experiment, some assumption/idealizations were made. During this experiment the system is treated as slow speed, steady state with incompressible flow, the pipe and machine walls are solid so viscous work is zero, changes of kinetic and potential energy were also neglected [2]. These assumptions/idealizations allow for the simplification of the energy equation to solve for total change in head see Eq 1.
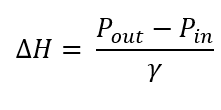
(Eq. 1)
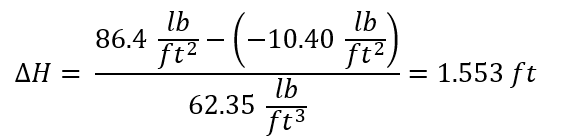
Where ∆H, is the total change in head [ft], Pout is the measured pressure leaving the pump [lb/ft2] , Pin is the measured pressure entering the pump [lb/ft2], and ϒ is the specific weight [ lb/ ft3 ]. The specific weight of water at room temperature is 62.35 [lbf / ft3] [2]. The available head or total head of flow is always positive [2]. This value is regularly calculated in fluid mechanics to help choose an adequate pump for the system.
Experimental Setup and Procedure
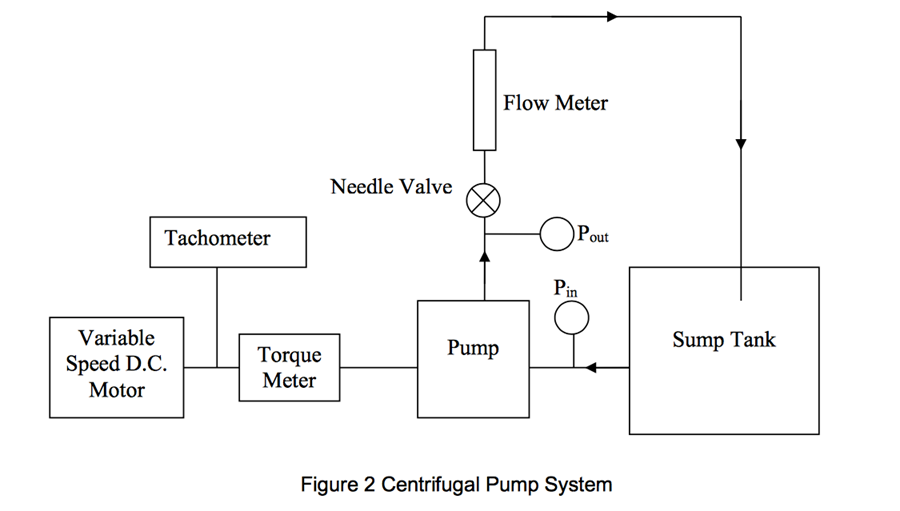
Schematic of the experimental setup used is presented in Figure 1. To begin this experiment, make sure all values are open and set the pump to a specific angular velocity. The angular velocity measurements will be taken in RPM and must be converted to rad/s. Once the shaft is spinning at a designated speed the volumetric flow rate can be varied, the flow rate can measured from the flow meter. Next the changes of head would need to be calculated using Eq 1. Afterwards the power output of the shaft must be calculated. See Eq 2.
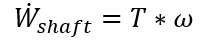
(Eq. 2)
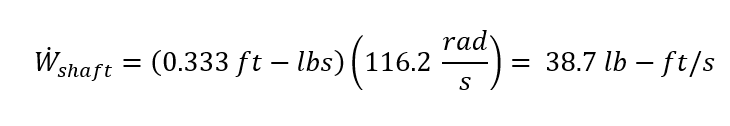
W_dot_shaft, is the power output of the shaft in [lb-ft/s], T is the shaft torque in [ft- lbs], torque measurements will be taken in in-lbs and must be converted to ft –lbs. Finally, ω is the angular velocity in [rad/s]. The final variable that must be calculated is the efficiency of the pump see Eq. 3.

(Eq. 3)
Where η is the pump efficiency [%], W_dot_shaft, is the shaft power in [lb-ft/s] and W_dot_pump, is the power output of the pump [lb-ft/s]. Finally the relationship between the volumetric flow rate and the other variables can be graphed.
Experimental Results
All experimental results are presented the Appendix. The experimental calculated values for all three angular velocities are listed below. See Table 1: Results 950 RPM, See Table 2: Results 1110 RPM, See Table 3: Results 1340 RPM.


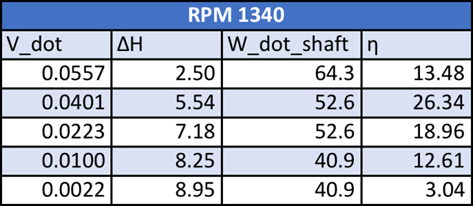
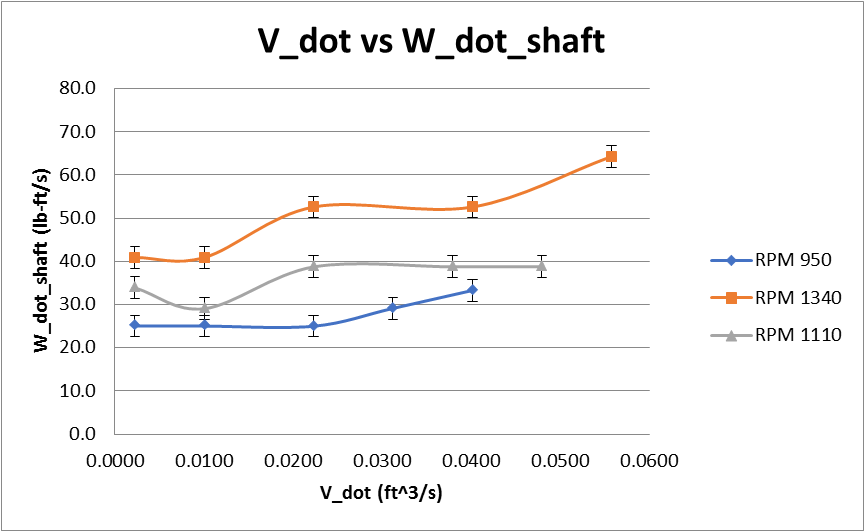
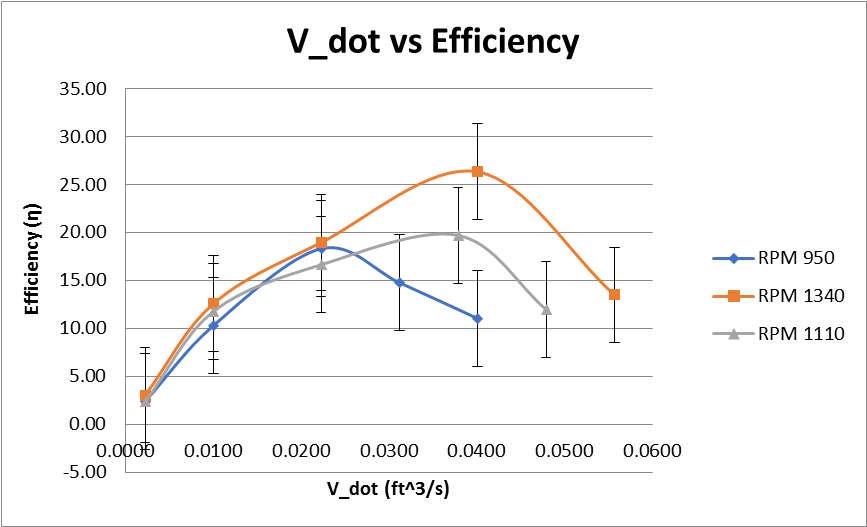
The data of tables 1 -3 was used to create Figure 2 -4, which graphs the relationship of the volumetric flow rate and the change of head DH(V_dot) see Figure 2. The volumetric flow rate and the power output of the shaft W_dot_shaft( V_dot) see Figure 3. And the volumetric flow rate and the efficiency of the pump η( V_dot) see Figure 4. All graphs show the effect that the volumetric flow rate has on each variable at different angular velocities. All Graphs located on the following pages. Error bar represent uncertainties in the answer.

Discussion
Examining the data of Figure 2 one can see that there is a relationship between volumetric flow rate and change in head. As the volumetric flow rate increase the change in head decrease at an exponential rate. Also as the RPM increase, the change in head of the system also increases. This graph does have error bars to take into consideration the limitation of the measurements taken.
When examining the data from Figure 3 one can see that data is not as clear. The overall trend seems to be as the volumetric flow rate increase so does the power from the shaft. This trend is followed by the experiments done at 950RPM and 1340 RPM. The test which were done at 1110 RPM levels off near at the last few trials and do not follow this trend. Another trend is the higher the RPM the higher the power from the shaft. After comparing the data at 1110 RPM to the rest of the trials, there are obvious outliers in the data, which are likely due to the equipment used during the experiment. This test should be redone to maximize accuracy of data.
Finally when examining the data from figure 4 one can see a relationship between volumetric flow rate and efficiency. All three speeds follow the same pattern of a parabolic type curve. All three curves have a clear max efficiency for the range of volumetric flow rates tested. Also as the RPM of the pump increased, the efficiency of the pump would also increase. As the RPM increased, the max efficiency of the pump would be at higher volumetric flow rate. This graph also has the highest error bars due to the greatest error in these measurements.
Conclusion
One of the most surprising relationships to find was how the volumetric flow rate affected the efficiency of the pump. The uncertainties in this experiment were the greatest out of any experiment so far. This was mostly due to the quality of the equipment used during this experiment. A recommendation to increase the quality of the experiments would be to upgrade the equipment used. Also there were many idealizations which were made during this experiment such as no minor losses or friction losses were taken into account. Even though these losses might be minor they could add up and change the results.
References
- J.P. Holman, Experimental Methods for Engineers, 7th Edition, McGraw Hill, New York, 2001
- F. M. White, Fluid Mechanics, 5th edition, , McGraw Hill, 2003
Appendix
Data collected:


Sample Calculations (1110 RPM):
Torque (ft-lb):

V_dot (ft3/s):

Pout (lb/ft2):
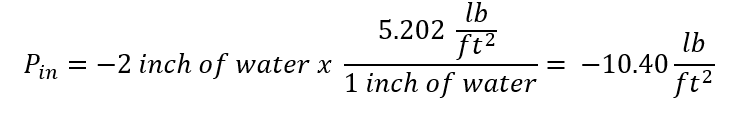
Pin (lb/ft2):
Total head:
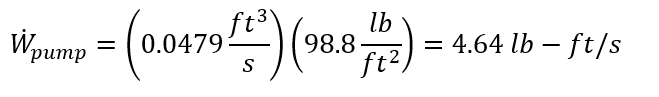
Pumping power:
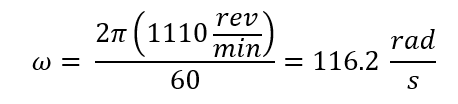
Angular velocity:
Shaft power:
Pump efficiency: