Forced Heat Convection
Abstract:
The purpose of this lab was to determine the effect of stirring and the hot water flow rate on the overall heat transfer coefficient. Based on the law of thermodynamics heat always travels from hot to cold but the rate of heat transfer is expected to be enhanced by the introduction of stirring. During this experiment, heat is transferred from the hot water flowing through the inside of the coil to the cold water in the vessel through means of both conduction and convection. To conduct this experiment the cold water flow rate was set to 1GPM, which was kept constant throughout the experiment. The flow rate of the hot stream was read directly off the Heat exchanger service unit HT30X, two different flow rates were tested. To calculate the heat transfer coefficient the following equations were used
. Where U is the heat transfer coefficient (kW/m2 K), Q_dot is the heat transfer rate (kW), A is the cross-sectional area (m2) and ΔT is the Logarithmic Mean Temperature Difference between the hot and cold fluid (K). After conducting this experiment a relationship between the heat transfer coefficient and the % stirring was found. As the % stirring was increased the coefficient of heat transfer also increased. The coefficient of heat transfer was also higher at lower flow rates. This relates to engineering anywhere that heat transfer is important such as a power plant or during a machining process where the workpiece must stay cool.
Experimental Results:
The experimental data extracted from the Heat exchanger service unit HT30X was recorded with uncertainties in Table 1- Table 6. The data is organized by the % stirring, on the left side of the table is the data for the mass flow rate of 0.01913 kg/s and on the right the data for the mass flow rate of 0.03088 kg/s.
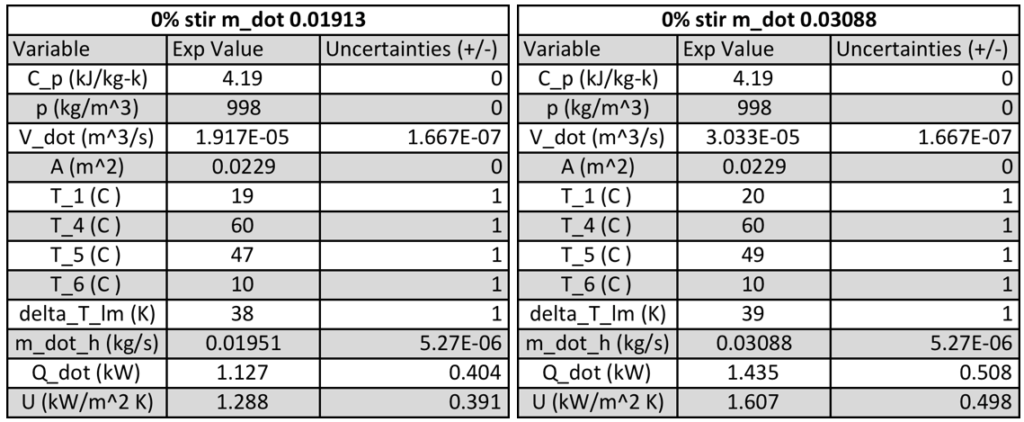
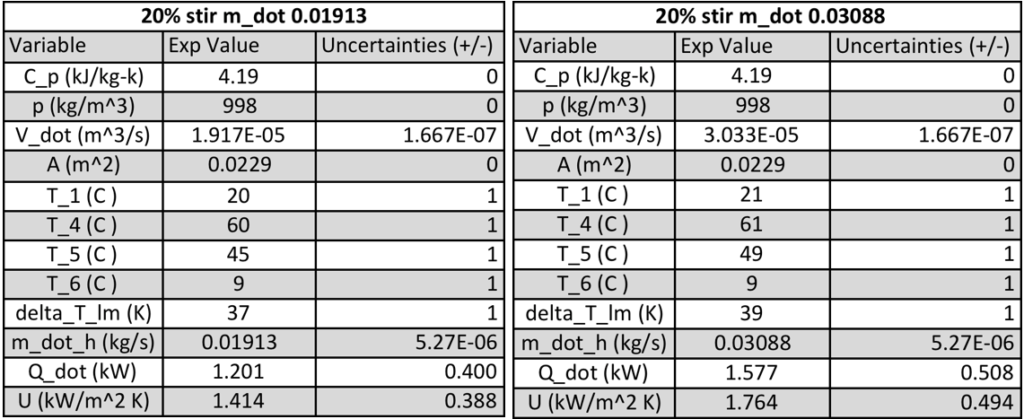
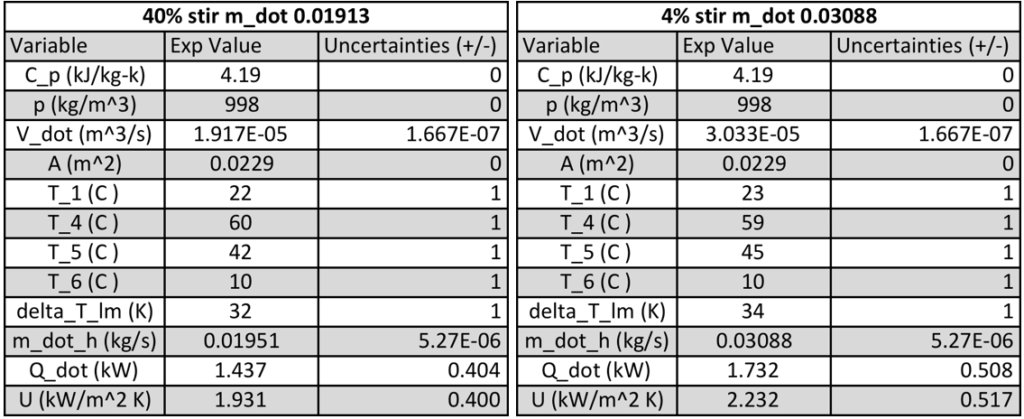
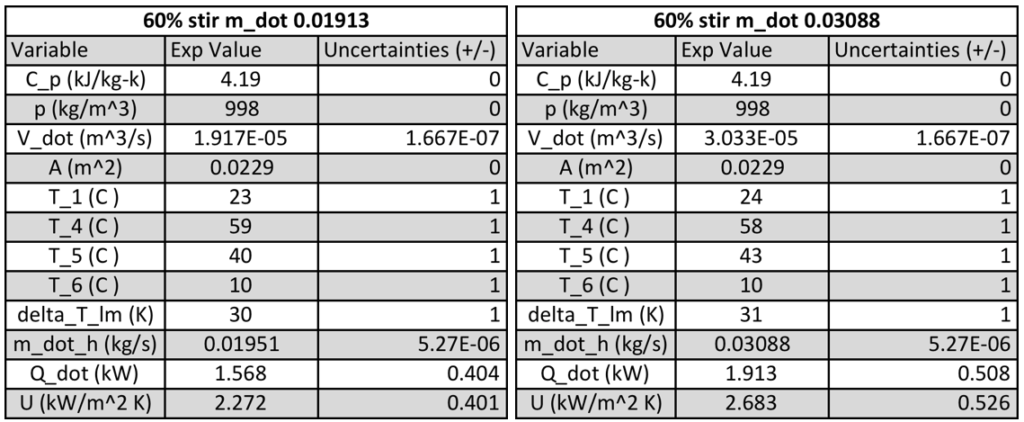
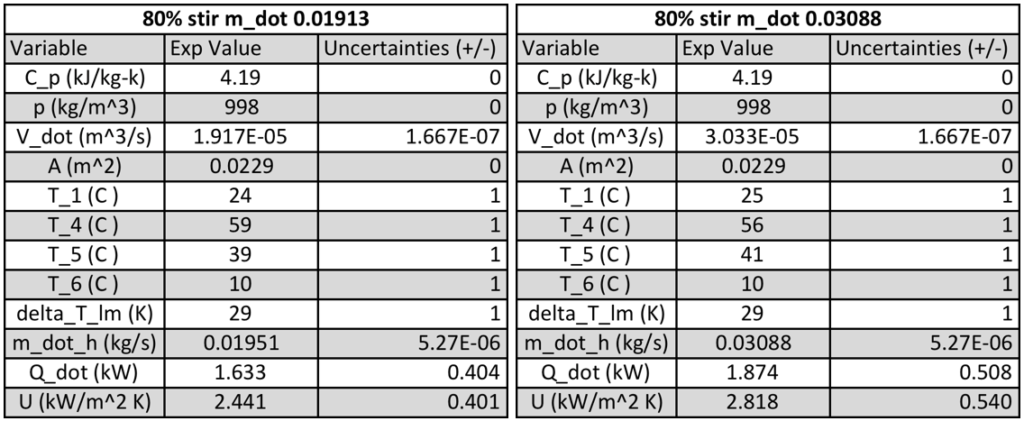

The data of Table 1 – Table 6 was used to create Figure 1, which graphs two curves: Each curve graphs the relationship between how the heat transfer coefficient changes with respect to how much stirring is occurring U(%stirring) at each of the flow rates examined during this experiment.
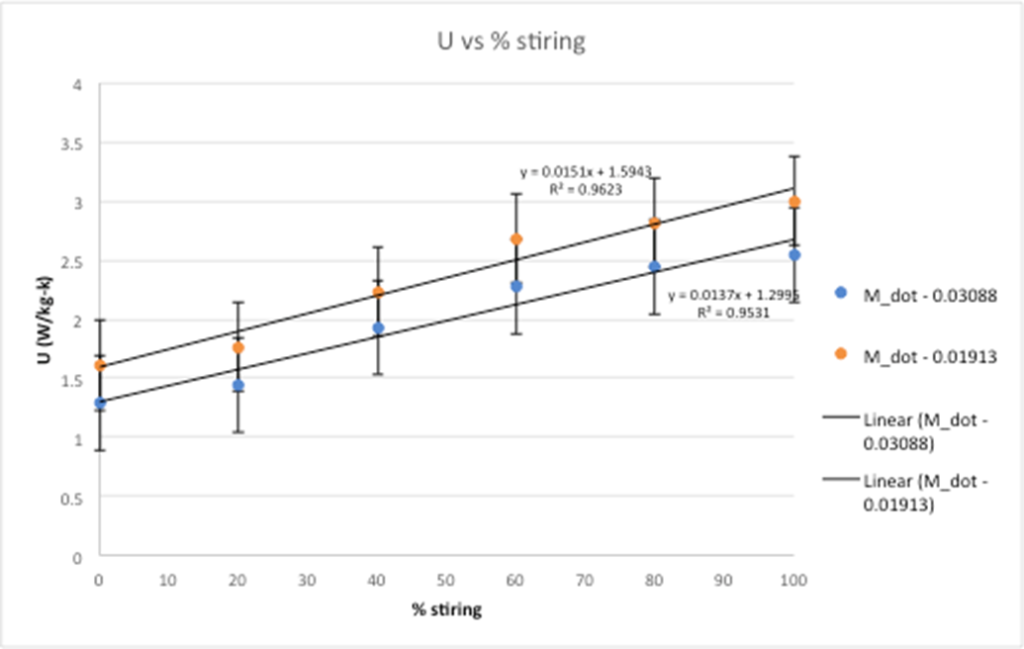
From the regression analysis, a statistically significant R2 value of 0.9623 was found for the data set at with a mass flow rate of 0.03088 kg/s, and the line of fit y = 0.0151x + 1.5943 was obtained. Similar results were found with a mass flow rate of 0.01913 kg/s with R2 of 0.9531 and a line of fit of y = 0.0137x + 1.2295. The statistically significant R2 values support that % stirring and the heat transfer coefficient (U) are indeed directly proportional.
Sample Calculations
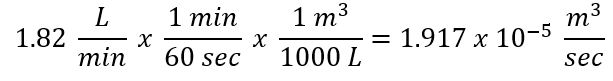
Convert (L/min) to (m3/sec):
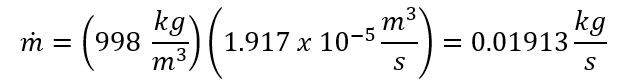
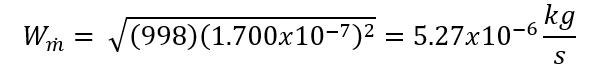
Mass flow rate (kg/s):
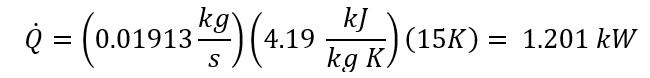
Heat Transfer Rate (kW):
Surface Area (m2):

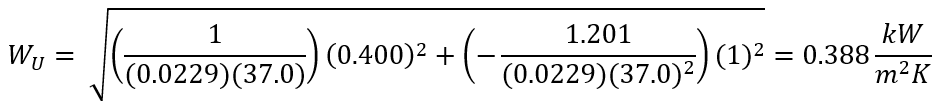
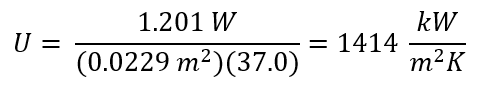
Heat Transfer coefficient (kW/m2K):
Uncertainty of ΔT (K):

Uncertainty of m_dot (kg/s):
Uncertainty of Q_dot (kW):

Uncertainties of U (Kw/m2K):