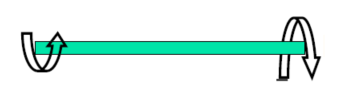
What is simple torsion and why is it important?
What is an example of torsion force?
An example of a torsional force would be anytime a force acting on an object results in a twisted or rotating motion. This twisting movement happens when an applied torque or force encounters an opposing force which generates shear strain. This opposing force could be a result of friction in the system or because one of the ends is fixed preventing the rotational movement. These forces are can be classified as torsional forces.
Imagine you have a pool noodle and a solid shaft. If you hold both ends of each of these objects and try to twist them you will soon see that it is very easy to twist the pool noodle whereas the metal solid shaft is much harder to twist. The sold metal shaft is able to withstand a higher maximum shear stress.
Why is torsion important in engineering?
It is important for engineers to understand torsion because anytime you have rotating parts, you will be dealing with torsion. Whenever you are designing a part you need to ensure that the part you are using is going to withstand the torques that it will be subject to in its everyday use.
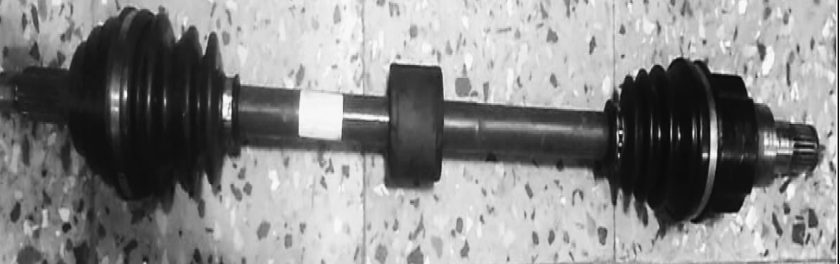
For example, when designing a drive shaft automotive engineers need to consider the torsional buckling strength, bending natural frequency, static deflection, shaft stiffness, the critical natural frequency of torsional vibration, and total mass of the drive shaft.
Where are torsion bars used?
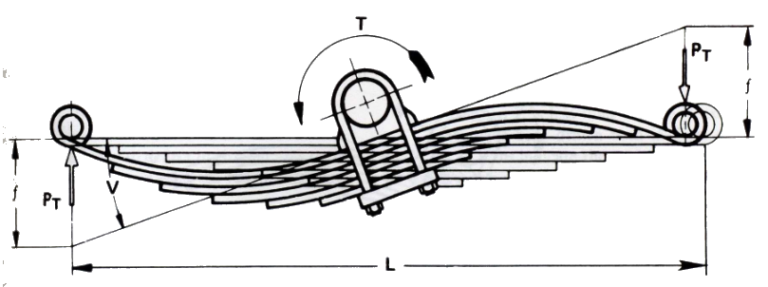
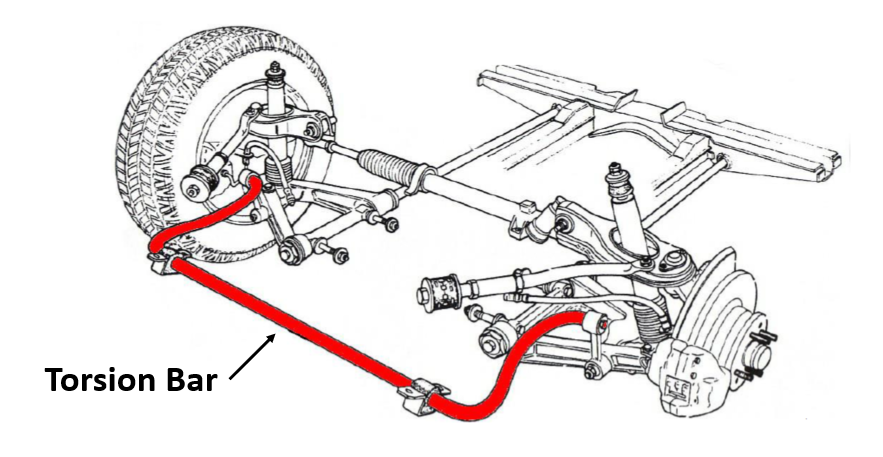
An example of a torsional bar would be an anti-roll bar also commonly referred to as an anti-sway bar, sway bar, or stabilizer bar. The anti-roll bar is used in many automobile front suspension systems and is usually made from a steel element with part of the bar held rigidly to the frame and the other free end twisted by a lever connected to the control arm. The purpose of the anti-roll bar is to help reduce the body roll of a vehicle during fast cornering or over-road irregularities.
What is the purpose of the torsion experiment?
The purpose of a torsional experiment is to see how different engineering materials respond when torque is applied to them. Torsion testing requires the twisting of a specimen along its primary axis and is a practical test for acquiring mechanical property data like torsional shear stress/strain, maximum torque, shear modulus, and breaking angle of a material.
Other valuable information which can be found in a torsion experiment is the relationship between the length of the shaft, torque, and angle of twist. In the bio-medical field, torsion testing is used to test materials that may experience a torsional load like a metallic bone screw, an intramedullary rod, or rubber tubing that may become twisted, or measure the shear strength of a bond between an implant and native tissue like bone.
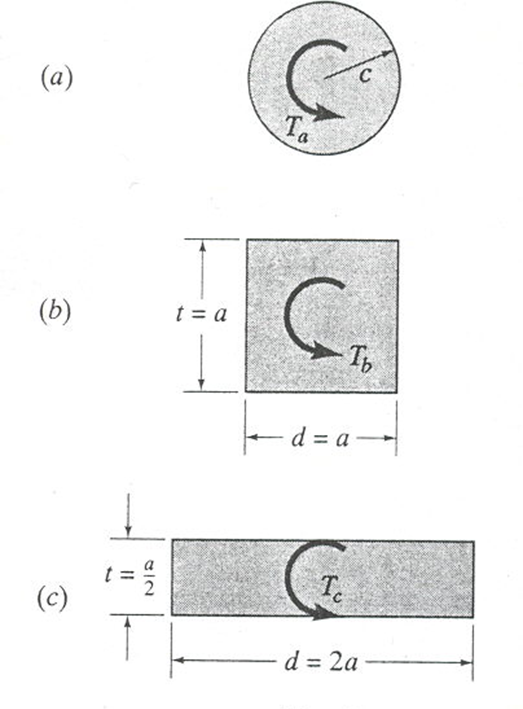
What shape is best for torsion?
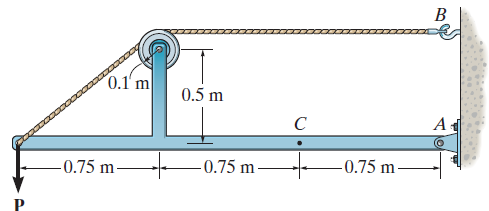
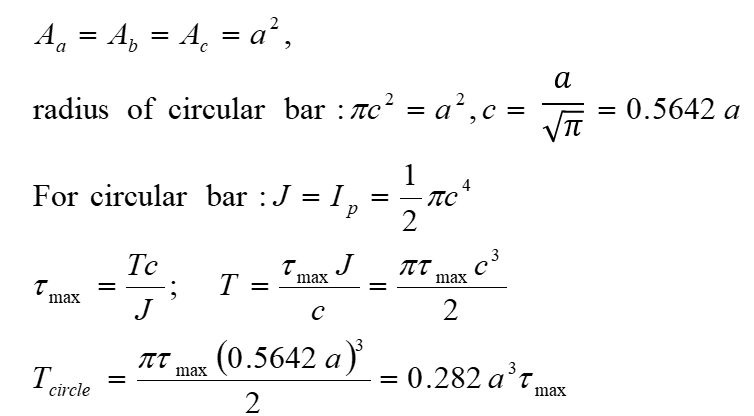
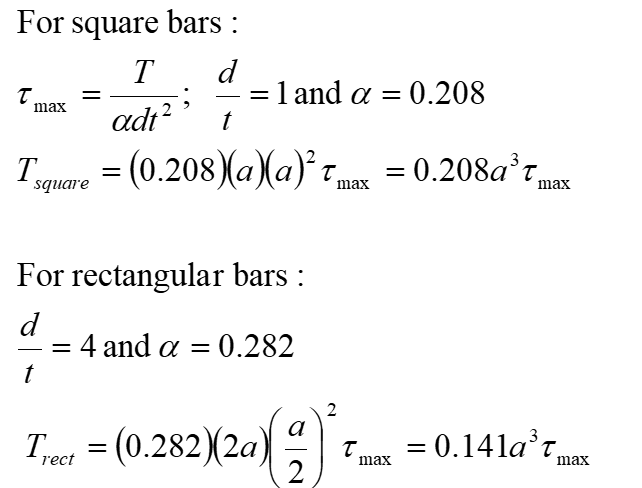
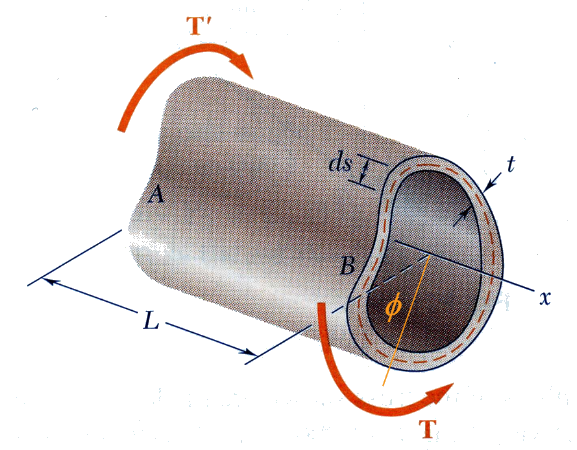
The shape of an object can affect the maximum sheer stress that an item can carry. Hollow tubes such as pipes are generally the most efficient shapes for carrying torsional loads. However the effect of shape can be seen in the example below: If torsion members having the cross sections shown in the figures below have the same cross-sectional area and are subject to torques that produce the same maximum shear stress in each, what is the torque carried by each?
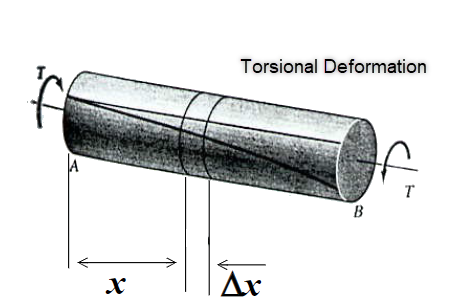
What is the angle of twist?
The angle of twist is the angular deformation of an object caused by twisting motion (Torque).
How do you perform a torsion test?
Materials:
- The rod specimens
- Twist and bend test machine MT 210
- vernier calipers
- Meter stick
- Safety glasses
Procedures:
- Before beginning the experiment put on safety glasses.
- Put the rod specimen through the torsion fastening components of the bearers and lock it into the fixed bearer first.
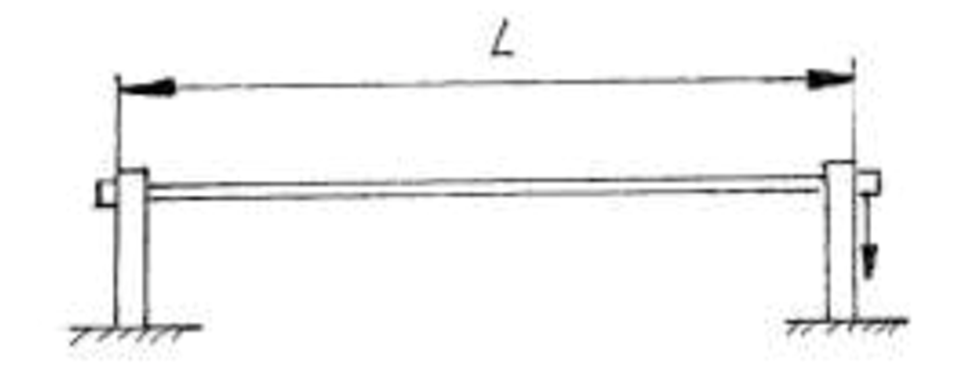
- Using the meter stick set the span of the rod (L) to 600 mm by adjusting the bearers as needed. See Figure 1:Twist and bending machine setup.
4. Securing the specimen to the lever mounted in bearings so the gauge is in close contact with the upper limit pin.
5. Set the testing device so that the top of the gauge is just in front of the groove of the lever
6. Lower the gauge so that its small hand is at about 10, and set the gauge to zero by twisting its outer ring.
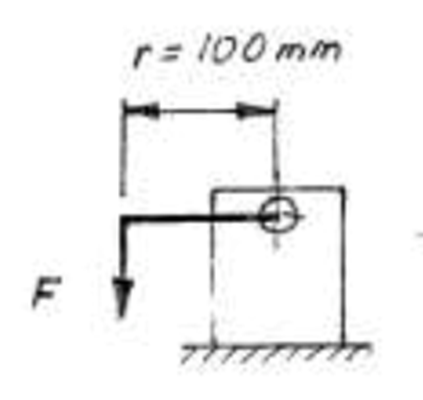
7. Apply the load, using the loading device. See Figure 2: Applying load to the rod.
8. Record data, and after each reading make sure to reset the gauge back to 0.
9. Repeat sets 7-8 for each of the different loads applied to this rod. (Testing how changing the force (F) affects the angle of the twist.
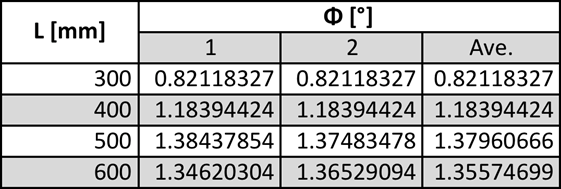
10. Repeat steps 3-8 but for each trial vary the length (L) of the rod by adjusting the bearers. Make sure to keep the loaded applied to the beam constant. (Testing how the length of the rod affects the angle of twist)
11. Repeat steps 3-8 but for each trial change the rod while keeping length and load constant. (Testing to measure how different materials respond under the same condition)
Theory:
The theory behind this experiment is to find out which material would be best for different applications. To make sure that the materials which are picked will not fail during their normal operating function due to twisting or a moment. Based on the theory we can expect that as the length increases the twist angle will increase, and as the load increases the angle of twist will also increase.
How is torsion calculated?
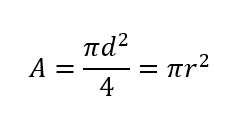
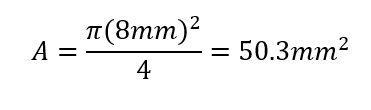
Cross-sectional area (A):
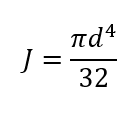
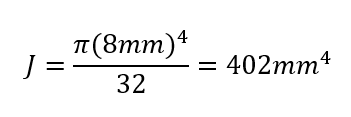
Polar Moment of Inertia (mm4):
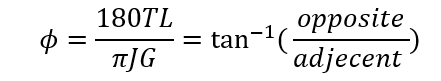
The angle of Twist ( o ):
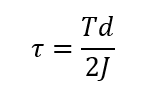
Shearing Stress (Pa):
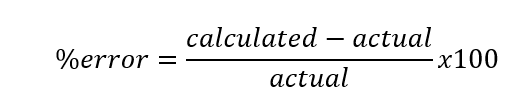
% error:
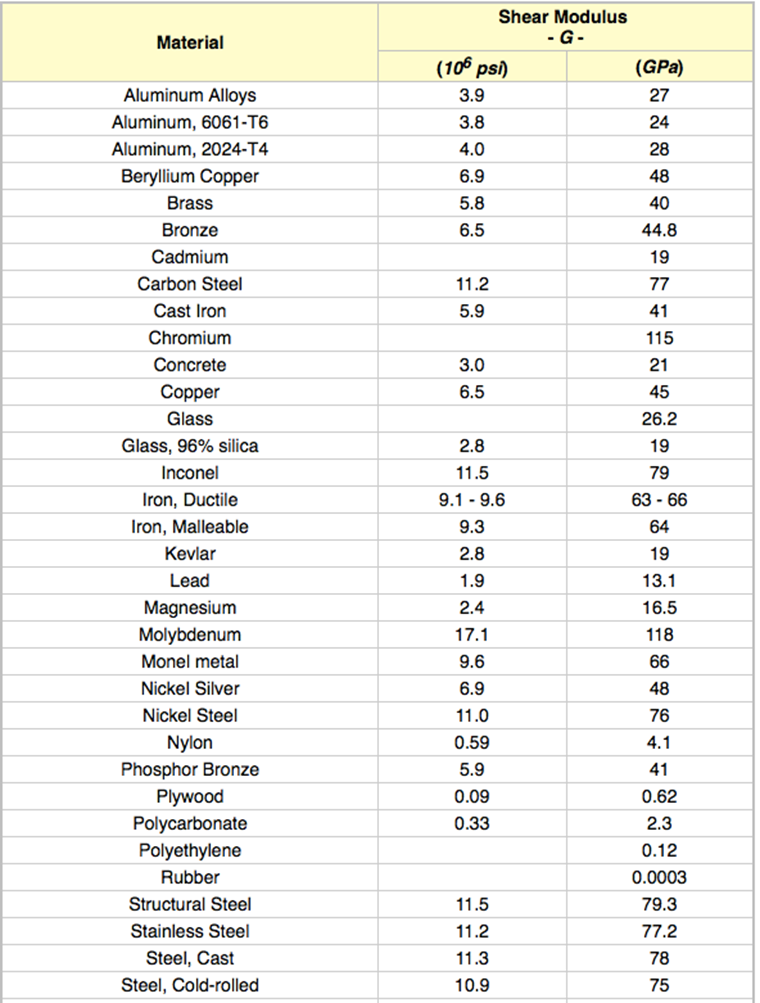
Published data charts:
Example calculation :
Cross-sectional area (A):
Polar Moment of Inertia (mm4):
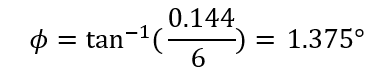
The angle of Twist ( o ):
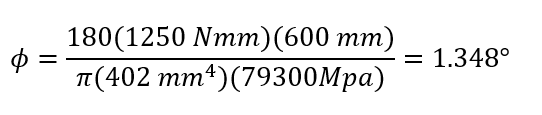
The angle of Twist ( o ):
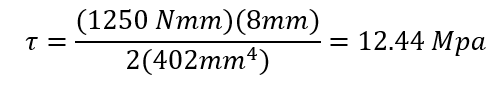
Shearing Stress (MPa):
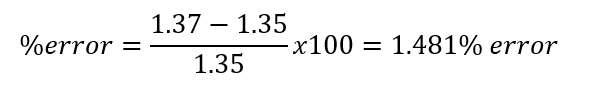
% error:
Data sets:
What is the conclusion of the torsion test?
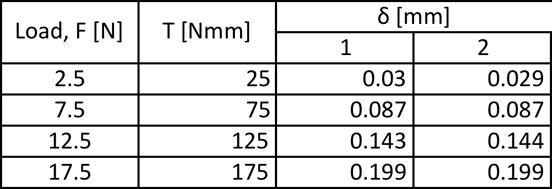
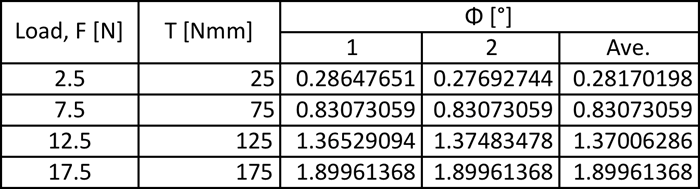
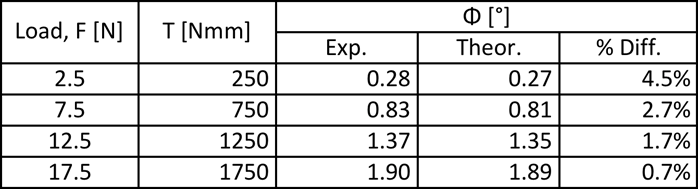
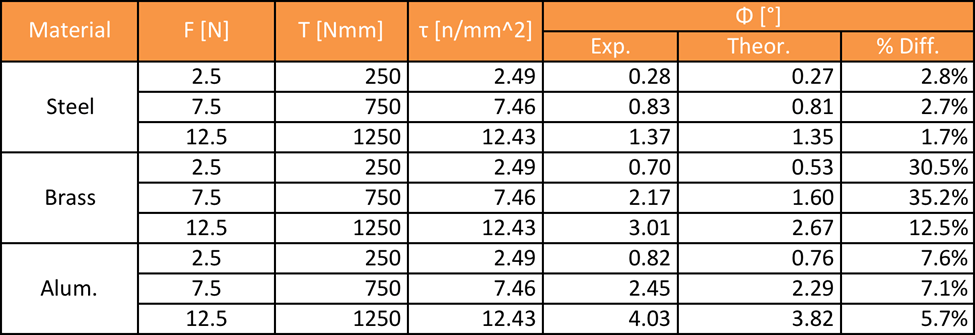
The results from this experiment do verify the initial hypothesis of the relationship between the angle of twist to different variables such as the length of the rod, the moment applied to the rod, and the material of which the rod is made. In the first part of the experiment the load (F) was varied from 2.5N -17.5N the moment arm was kept the same length of 10cm (100mm). So as the load increased the moment that the rod was put under also increased. What was observed was that the angle of twist increased linearly as the moment was increased. The first part of the experiment also resulted in having a very low percent error, which ranged from 0.7%-4.5% error.
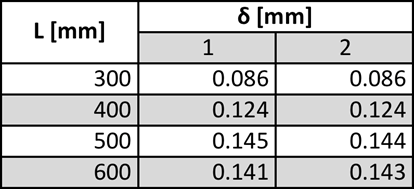
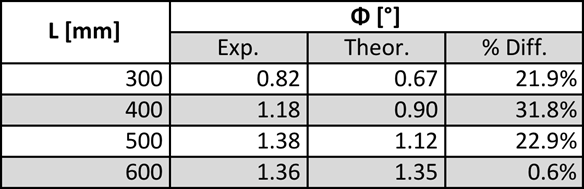
For the second part of this experiment, the moment exerted on the rod was kept constant the length of the rod was adjusted, and moving the supports to the desired length. As suspected as the length of the rod increased the angle of twist also increased. The distribution of the % errors was a lot greater as they ranged from 0.6%-31.8% error. One of these reasons for the higher distribution or error cold has resulted in the fact of the rod had to be readjusted for every different trial which introduces some errors. If the rod was not clamped down as tightly as in the other trials this could have affected the final result.
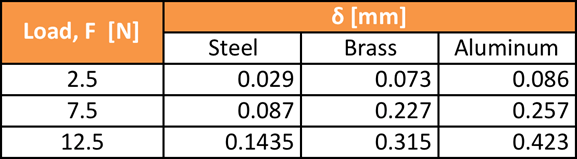
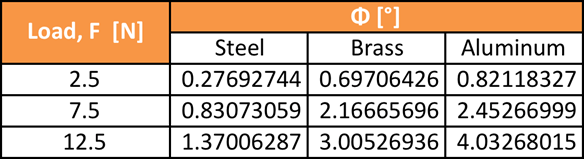
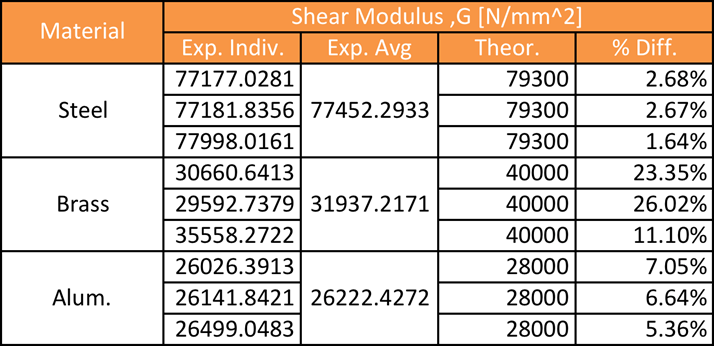
For the final part of this experiment, different material rods were tested to see how the material affects the angle of twist. As suspected the softer materials would have a higher angle of twist than the harder materials. The total range of %error varied from 1.7%-35% error, but if you do not include brass the %error in this part of the data was 1.7%-7.6%. for some reason, the brass had a much higher % error than the steel and aluminum rod. Finally, the shear modulus was then calculated and compared to the true values that were found on engineeringtoolbox.com, the range of % error varied from 1.64%-26.02% with brass once again having the highest %error. If you do not include the results from brass then the distribution of % error is a lot closer together ranging from 1.64-7.05% error.
References:
- Modulus of Rigidity of some Common Materialshttp://www.engineeringtoolbox.com/modulus-rigidity-d_946.html
- Morrow H. , Kokernak, R. person’s statics and strength of materials 7th edition, 2010
- Yusuf Khan, Characterizing the Properties of Tissue Constructs for Regenerative Engineering, Editor(s): Roger Narayan, Encyclopedia of Biomedical Engineering, Elsevier, 2019, Pages 537-545, ISBN 9780128051443,https://doi.org/10.1016/B978-0-12-801238-3.99897-0.