Sieve test and Hydrometer test for grain size classification
MEMORANDUM
To: Dr. Jonathan Wu Date: February 9th 2017
From: Diego Sandoval-Torres
Subject: Sieve test and Hydrometer test for grain size classification.
Sample Description:
The soil used in the experiment was obtained from a larger sample in the
laboratory. The sample showed various grain size from clay all the way to pebbles. The soil was
moist and had a brown to dark brown color to it. No visible organic content in the soil sample
that was used, not to the naked eye.
Test Purpose:
The purpose of this laboratory was to determine the soil particle sizes that
composed a given sample of soil. The sieve testing will separate the larger size grains, from
pebbles to sand, including a smaller position that will contain the clay and silt size grains. The
hydrometer test is used to determine the grain diameter at a smaller scale, for this, the pan
collected soil was used to determine the size, which the sieves test was not able to determine.
Test Results: We were able to determine the content per sieve container, we weighted each sieve
before and after capturing soil. This gave us an idea of how much each sieve was able to collect,
based on the total weight we started, we determined the percentage of each soil. 6 sieves of
different sizes were staked and a pan was put at the bottom to collect finer soil particles.

The following equation was used to determine the total percent of soil retained in each sieve:

The percent passed of the soil in the test was calculated from the following equation:

For the hydrometer testing the following table of data was created:
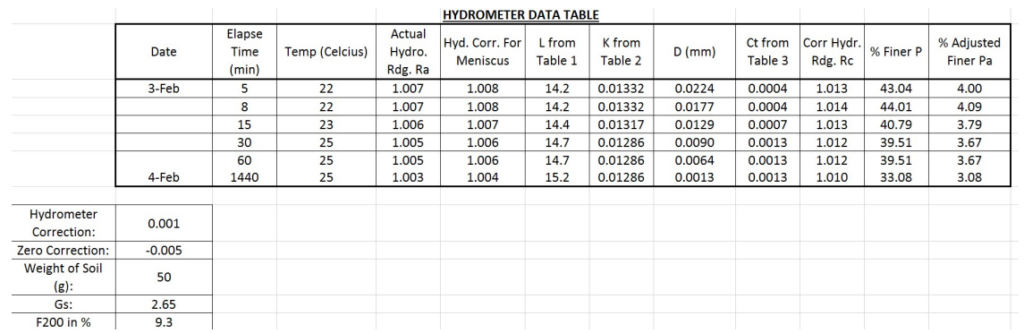
This test was conducted to determine the actual diameter of the particles that were too small for
the sieve test. The idea was to use the 151H hydrometer and correction coefficients to calculate
the % finer particles and the diameter.
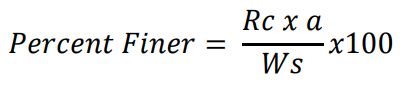
The percent of finer particles equations has 3 important variables that are used throughout the
experiment. The Rc variable is a corrected hydrometer reading per each measurement. The a is a
correction factor for the unit weight of solids.
The following equation was used to determine the particle diameter:

K is a constant given, and L is a length of the hydrometer, while t is time in hours.
In order to create a graph that provides the percentage of soils by each diameter size, we selected
all the information needed from the sieve test and the hydrometer test. The following graph was
obtained using Table 3 data.

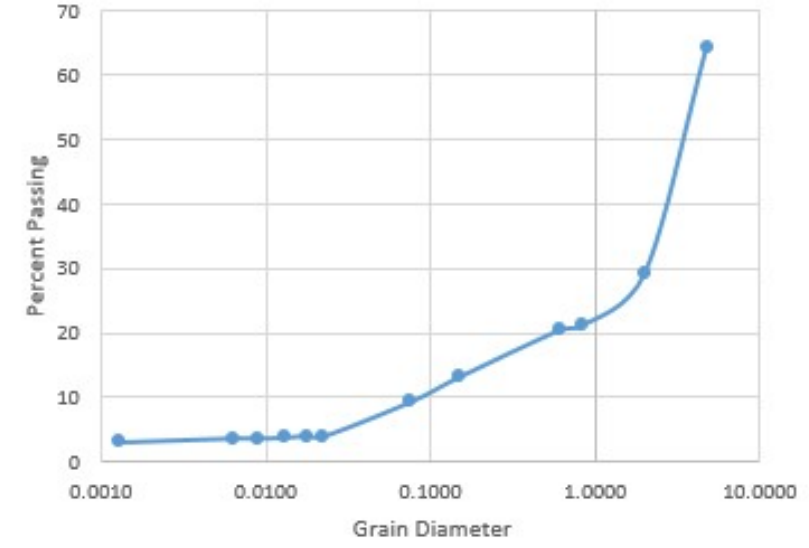
The graph indicates the retention of different soil particle sizes of different diameters.
Remarks:
The test had many flows, as it was not conducted according to the original procedure,
and there was also a lack of equipment. The weight of the mass used for the experiment was
obtained a scale that was not precise enough for the gram units we needed, as the scale was in
Kilograms and only gave us 2 decimal places. Another error on the data could have been that
during the settling of the soil in the hydrometer, while removing and replacing the hydrometer in
the test tube the water was moved a few times and that could have stirred the water with soil.
Calculation is also a big place for error, our graph did not look similar to the in class examples so
we have issues trying to comprehend the data error. A further detailed laboratory procedure
could ensure correction in the data as well as a more exact procedure for the calculation of new
data.