
Car Energy Management Explained: A Hybrid Sports Car Case Study
Why is car energy management important, especially in hybrid sports cars? The pressing environmental crisis and growing economic consciousness have necessitated a significant reduction in both fuel consumption and emissions from all vehicles. While conventional vehicles with internal combustion engines (ICEs) benefit from the high energy density of hydrocarbon fuels, they grapple with low efficiency. To address these challenges, governments globally have implemented new regulations. These include the imposition of stringent emission standards, restrictions on transportation activities, enhancements in vehicle fuel economy, and the promotion of green vehicles. However, auto enthusiasts still want a fun vehicle that gives them a thrill. As a result, this article deep dives into car energy management using a hybrid sports car as a real case study.
Motivation & Background
Racing is a sport that has been around for hundreds of years and continually pushes the boundaries of the automotive industry. Much of the technology on modern vehicles today was derived from the racing world, such as anti-lock brakes, traction control, and active suspension [5].

For the GTP class in the IMSA racing series to F1, hybrid electric powertrains are becoming increasingly common to increase the efficiency and speed of race cars. These complex powertrains require sophisticated control schemes to achieve optimal fuel efficiency and performance around the track.

The motorsport governing bodies such as IMSA and the FIA have imposed specific regulations on energy usage. These regulations are closely monitored and races are won through highly efficient energy utilization. A crucial aspect is restricting fuel consumption to 110 kg per race distance, with an additional limitation that the instantaneous fuel mass flow rate must not surpass 100 kg/h. This constraint ties the peak propulsive power directly to the internal combustion engine (ICE) efficiency, as the motor generator’s mechanical power is capped at 120 kW. Furthermore, the energy transfer during regen maxes out at 2 MJ per lap [10]. Finally, IMSA also caps the max energy at 920MJ energy limit/stint or time between pit stops [1].
The idea of letting software decide which power source does the work goes back to the first mass-market hybrid. According to journalist John J. Fialka, a former Wall Street Journal reporter and the founder of ClimateWire, Toyota’s David Hermance told the Journal in 2006 that the first-generation Prius team faced “80 different possibilities” for combining a gasoline engine with an electric drive, and that this created an enormous control problem. The answer, like most of the team’s solutions, involved computers and software: onboard computers decide which system should be doing what [15]. Toyota also lacked the time to prototype every candidate, so it compared four engine-motor systems in a virtual competition on simulation software [15]. The sports car study below works the same way at a smaller scale, simulating a parallel hybrid to compare energy management strategies instead of building each one. For the architectures themselves, see our guide to hybrid electric vehicles.
Problem Description/Objectives
This project will be centered on the 2 door hybrid sports car segment. This project aims to optimize the blend between electric and combustion power inputs into a fixed-gear transmission to achieve the highest fuel efficiency around a defined circuit, over an ICE architecture with the same characteristics.
To evaluate fuel efficiency improvements, the vehicle was simulated with and without hybridization over an existing velocity profile of the Daytona International race track.
Given that energy consumption is the most important part of designing an energy management strategy for HEV, and it is primarily impacted by the longitudinal motion of a vehicle, this project will only take into account the longitudinal dynamics of the vehicle and ignore other dynamic models such as vehicle lateral dynamics and steering dynamics [13]. This project will be assuming the track is flat, at sea level, and 20°C. Each energy management strategy will only be tested for 2 laps (300 seconds). Finally, each energy management strategy will be measured and must meet the judging criteria which were developed based on IMSA/ FIA racing regulations.

Benchmarking
The chosen vehicle segment for this project is a two-seater hybrid sports car. A few of the vehicles that were benchmarked were:

Vehicle/Powertrain Modeling
Vehicle Architecture
The primary benefit of hybrid vehicles lies in their ability to capture and utilize a portion of the energy typically lost during braking/stopping. In a series hybrid, the overall efficiency is impacted by both the ICE and the electrical power unit. To achieve greater efficiency than a parallel hybrid, the losses attributed to the engine and electrical motor must be less than the advantages gained from optimizing the load on the ICE through resizing and balancing. As a result, series hybrids excel in slower driving cycles and urban stop-start driving. Parallel hybrids demonstrate greater efficiency during higher/constant speed (highway driving) and track driving with quick accelerations [11]. Since our vehicle segment is a sports car we chose to model our vehicle as a parallel hybrid. This also aligns with our findings during our benchmarking, since all the competitive vehicles were also parallel HEVs.

Modeling Scheme/Architecture
Individual driving behaviors which can be affected by many different factors cause each driver to exhibit a high degree of uniqueness in their driving. Some of these factors include a driver’s internal psychological state, responses to the traffic environment, and societal influences. Therefore, vehicle performance can be impacted by personalized driving styles and it can be inferred that driving behaviors substantially impact the energy management of electrified vehicles [12]. A forward-looking model examines all these factors, but as a result, it does not follow the driving cycle exactly. In the backward-looking model, the input driving cycle is assumed to be followed perfectly, thus rendering the vehicle speed non-dynamic.
Due to all these complexities with a forward-looking model, it was decided to model the vehicle as a backward-looking model. Thus, it is assumed that the driver will be following the driving cycle exactly for each lap, making the state control variables relatively constant. This also allowed the team to focus more on drive cycle, vehicle, and control strategy modeling rather than driver dynamics.

Model
Based on the backward-looking model above, our project-specific model was created:

The main tools used to complete the model are MATLAB/Simulink, including Simscape, Simscape Battery, and Stateflow. The Motor and engine maps were obtained from EPA Alpha. Finally, a detailed look of each subsystem will be detailed below.
Track/Cycle
The Daytona International Speedway was chosen as the track that would be used as the basis for the simulation drive cycle. The track was modeled using Autodesk Fusion 360 and geometry was compiled into a small database that discretizes the track into sections denoting the section length, track position (as cumulative length), curve radius, and a calculated max corner velocity.

Maximum corner velocity was calculated by performing force balance calculated in the lateral vehicle direction and solving for v. Where m is vehicle mass (1700kg), v is vehicle velocity, r is the radius of curvature, Mu is the tire coefficient of dynamic friction [1], and g is gravity. For this problem, Mu was tuned to give a realistic corner speed in dry ideal conditions. In the straight sections, r and max velocity are set to zero just as a placeholder to differentiate from a curve.

To develop a velocity profile for a given vehicle around this circuit, vehicle performance had to be determined. A forward-looking vehicle model was created using the backward-looking model parameters and simulated for a time for full-throttle acceleration until acceleration was near zero. This generated a relationship between vehicle speed and available maximum acceleration. This was appropriate behavior because the model will approximate an ideal race driver, who accelerates at full throttle when possible. For a vehicle that weighs 1700kg, the zero to 60 mph acceleration time is aligned with published manufacturer times for vehicles of the same power and weight.


Finally, velocity was derived from the track geometry and performance. A MATLAB script was written to determine what state the vehicle needs to be in to maintain traction on the track. Below is the logic used to determine the different acceleration states of the vehicle at each section in the track. Braking is predicted by the speed limit of the future state j+1 and the current speed. When the current position was greater than the section distance minus braking distance, acceleration was put to the braking acceleration value. Braking acceleration was assumed to be constant -1.2 g’s [9]. The final result shown below leads to lap times of about 150 seconds which is slower than some published times, but reasonable, provided the lower power of the car used for this simulation [8].


Vehicle, Tire, and Final Drive
Taking the velocity and acceleration as inputs, this part of the model calculates the forces due to aerodynamics, rolling resistance, and vehicle mass. Adding these together and multiplying by the wheel diameter, we can find the torque at the wheel. Multiplying by the final drive ratio, we get the torque input to the transmission.

The equation used to calculate the tractive force is

Where
F_t (t): Tractive force
F_a (t): Aerodynamic force=1/2 ρ_a A_f C_d 〖v(t)〗^2
F_r (t): rolling-resistance force=μ(v,p,…)m_v*g*cos(α)
F_g (t): Gravitational force=m_v gsin(α)
Vehicle parameters introduced in this model:
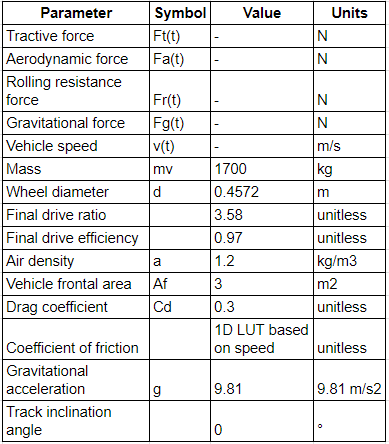
Finally, tractive torque (torque to transmission) and transmission output speed are calculated:

Vehicle Block

Tire Block

Differential/Final Drive Block

Transmission
The transmission uses the vehicle’s velocity and engine RPM to determine the appropriate gear. The gear ratios in the transmission model were designed to resemble the 9-speed transmission in the Acura NSX (as benchmarked above). By factoring in the gear ratio and the necessary torque and rotational velocity of the final drive, the transmission model can compute the transmission’s torque (Nm) and rotational speed (RPM).

Gear Logic:

Table of gear ratios and shift points:
| Gear | Ratio | Upshift Threshold | Downshift Threshold |
| 1 | 3.84 | – | Velocity < 10 m/s Transmission speed < 4000 RPM |
| 2 | 2.4 | Velocity > 11 m/s Transmission speed > 5500 RPM | Velocity < 15 m/s Transmission speed < 4000 RPM |
| 3 | 1.67 | Velocity > 18 m/s Transmission speed > 5500 RPM | Velocity < 20 m/s Transmission speed < 4000 RPM |
| 4 | 1.43 | Velocity > 25 m/s Transmission speed > 5500 RPM | Velocity < 25 m/s Transmission speed < 4000 RPM |
| 5 | 1.21 | Velocity > 29 m/s Transmission speed > 5500 RPM | Velocity < 30 m/s Transmission speed < 4000 RPM |
| 6 | 1 | Velocity > 35 m/s Transmission speed > 5500 RPM | Velocity < 35 m/s Transmission speed < 4000 RPM |
| 7 | 0.84 | Velocity > 40 m/s Transmission speed > 5500 RPM | Velocity < 40 m/s Transmission speed < 4000 RPM |
| 8 | 0.6 | Velocity > 44 m/s Transmission speed > 5500 RPM | – |
Engine + Electric Motor
It was initially intended to use engine and motor data from a two-door sports car, but this data is not obtainable. The available engine (Toyota 2.5L) and motor (60kW Prius) were chosen from the EPA Alpha database [7]. Engine torque was doubled to better match racetrack demand. A 2D LUT is used to look up engine BSFC and motor efficiency. Then the output fuel rate and electric power demand from the battery was calculated.
Engine:

Motor:

Battery
The battery model for this study was constructed based on parameters extracted from the file hev.m and subsequently adjusted. A simple OCV-R equivalent circuit was employed to calculate battery performance, with open circuit voltage and internal resistance being dependent on the battery state of charge (SOC). Scaling of the battery involved modifications to the energy capacity of 1.35 kWh and resistance values. The following equations detail the calculation of the SOC, voltage, current, and power:


Where:
| Unit | Meaning |
| e | Coulombic efficiency |
| Vocv | Open circuit voltage in volts |
| Rb | Internal resistance of the battery in ohms |
| Pb | Battery power consumption in watts |
| Ib | Battery current in amperes |
| Q | Capacity of the battery in Ah |
The following table illustrates the parameters used for the battery model:


What is a battery management system (BMS)?
It’s worth distinguishing a battery management system (BMS) from the car energy management strategies covered in this article. A BMS is a hardware and firmware component that monitors and protects the battery pack itself — it doesn’t decide how power is split between the engine and motor. Its core functions are:
- State of charge (SOC) and state of health (SOH) monitoring — tracking how much usable capacity the battery has left, both right now and over its lifetime.
- Cell balancing — keeping individual cells within a pack charged and discharged evenly, since a pack is only as good as its weakest cell.
- Overcharge, overdischarge, and thermal protection — preventing the battery from operating outside safe voltage and temperature limits.
- Communication — reporting battery status to the vehicle’s other control systems, including the energy management strategy that decides how to use that power.
The energy management strategies covered in the rest of this article (fuel rate strategy, engine optimum operating line, dynamic programming) all operate downstream of the BMS — they assume the battery is being safely monitored and simply decide how much of its available power to use at any given moment.
Energy Management Strategy
Control Approach – Fuel Rate Strategy
Strategy Description
This energy management control approach tries to minimize the total equivalent fuel consumption, based on the following equation:


Using this Equivalent Consumption Minimization Strategy (ECMS), the control approach is as follows in the figure below and implemented in Stateflow. Also included in the model is regenerative braking and motor shutoff when SOC reaches a certain threshold.

Tuning/Calibration Criteria
| Calibration parameters | Value |
| Torque request % allocation during regenerative braking | Motor: 5% Engine: 0% |
| Start and reset torque request % values (reset – after regen period) | Motor: 30% Engine: 70% |
| Torque request % change increment per iteration | 1% |
| SOC depletion limit | 30% |
| Battery recharge to use again | 50% |
Control Approach – Engine Optimum Operating Line (OOL)
Strategy Description
This energy management control approach tries to operate the engine at its optimal efficiency point depending on engine speed. During accelerations, the motor will apply torque to the drivetrain to reduce the demand on the motor. During zero acceleration, the motor will apply negative torque to the drivetrain to increase demand on the motor while increasing the battery SOC.

Control Approach – Dynamic Programming (DPM)
Strategy Description
This energy management control approach aims to break the problem into discrete optimizations provided a final state cost by finding the minimum cost-to-go for each optimization L [14]. It was attempted to use the DPM Matlab program provided, but this was ultimately not successful due to the time required to debug so a Simulink model was developed that was not meant for general purposes. For better final state control, a penalty was applied to the equivalent motor fuel rate. The resultant optimal engine and motor torque values for each discrete point was then input into the engine/motor torque blocks in the base simulation to obtain final fuel consumption.


Simulation Results & Discussion
The energy efficiency of a hybrid vehicle is contingent upon the operational load the vehicle is subject to. The electrical motor/generator exhibits an efficiency ranging around 90%, indicating that the predominant energy losses in a hybrid system originate from the IC engine, which attains a maximum efficiency of around 40% [11].

As a result, maximizing the time in which a vehicle is running solely as an EV will increase the total efficiency of the vehicle, decreasing the total energy consumption. It is also important to remember that even though gasoline has a very high energy density (43.4 MJ/ kg = 43.4 kJ/g) the vast majority of that energy is lost in an ICE in the form of heat and sound energy.
Results table:
| # | Strategy | Equivalent fuel used (g) | Total Energy (kJ) | Total Energy (MJ) |
| 1 | Engine only | 2750 | 58000 | 58 |
| 2 | Motor only | 100 | 5000 | 5 |
| 3 | 50/50 split | 1500 | 45000 | 45 |
| 4 | fuel rate strategy | 1400 | 35000 | 35 |
| 5 | fuel rate strategy with acceleration check | 1250 | 21000 | 21 |
| 6 | Maintain engine OOL, vary the motor to compensate | 2500 | 85000 | 85 |
| 7 | DPM | 2500 | 110000 | 110 |
The first strategy executed was “Engine Only”. This strategy served as a baseline against which all other optimization strategies would be compared. Since all other optimization strategies were intended to involve some form of electrification, ideally, they should outperform the baseline. The key parameters to note here are the equivalent fuel consumption at around 2750g and the total energy consumed by the vehicle, which is 58000 kJ (58 MJ).
Among all the different energy management strategies studied, Strategy 7 (DPM) was the only one that did not meet the criteria against which each strategy was evaluated. The DPM strategy failed to adhere to the maximum mass flow rate of gas criteria, reaching a peak of approximately 30 g/s of fuel consumption. Additionally, it exceeded the criteria for maximum energy consumption per lap by 8MJ. This exceedingly high value of total energy seems to be incorrect and likely due to a programming error in our model.
All vehicles meet the fuel consumption criteria of not exceeding 1549g of fuel/ lap and they also all met the 2MJ cap on energy transfer/ lap.
Conclusion
Out of the remaining four energy management strategies (3, 4, 5, & 6), the one with the lowest fuel consumption and energy usage was Strategy 5 (Fuel Rate Strategy with Acceleration Check). This energy management strategy closely resembled Strategy 4 (Fuel Rate Strategy), with the distinction that instead of initiating the regen process when the battery dropped below a certain threshold, Strategy 5 would commence the regen process whenever the vehicle experienced any form of deceleration. This led to more frequent regen cycles compared to Strategy 4, ultimately leveraging the battery more per lap than Strategy 4. However, it is important to note that these different strategies were judged based on their efficiencies for only 2 laps.

After running several different strategies, it appears that most do not utilize the powertrain sufficiently for a hybrid application. This is mostly because of the constraints of the hardware chosen. As seen below, it was apparent that the engine-only simulation operates near the maximum torque during much of the time, there is not much energy available during regen to efficiently maintain SOC. One thing that can be done to improve this is to better tune the ECMS parameters (k-values) and battery energy use penalties to utilize more of the SOC range within the 2-lap time frame while preserving SOC for future time periods.
If this work were continued, a different engine would be selected that is more powerful and can utilize a more efficient part of the engine map while retaining sufficient engine power to reach baseline simulation track time. The transmission shift strategy would have to be optimized to use more efficient regions of the map. Alternatively, a power-split hybrid could be used so that specific torque/speed points could be reached. Unless the battery is charged during pit-stops, hybridization using the chosen engine, motor, and battery is not recommended.

Frequently Asked Questions
What is car energy management?
Car energy management is the strategy a vehicle uses to decide how to split power between an engine and an electric motor (in a hybrid) or manage battery output (in an EV) to balance fuel efficiency, performance, and battery state of charge in real time.
What is a battery management system?
A battery management system (BMS) is a hardware and firmware component that monitors and protects a vehicle’s battery pack, handling state of charge and state of health monitoring, cell balancing, and overcharge, overdischarge, and thermal protection, separate from the energy management strategy that decides how to use that power.
What is the difference between energy management and a battery management system?
Energy management decides how to split power between an engine and motor (or how much battery power to use) to optimize efficiency and performance. A battery management system operates one level down, monitoring and protecting the battery pack itself so the energy management strategy has safe, reliable power to work with.
References
[1] Luca. (2023, October 5). Le Mans Hypercar: LMH and LMDH 2024 Guide. Automotive Enthusiast. https://a-e.li/reports/le-mans-hypercar-lmdh/#7-aerodynamics
[2] https://en.wikipedia.org/wiki/IMSA_GTP#Fall_of_GTP
[3] See lmdh_technical_regulations_2022.04.05.pdf
[4] Ceppos, R. (2023, February 5). Hybrid Powertrains at Daytona: We Take a Deep Dive into the Technology. Car and Driver. https://www.caranddriver.com/news/a42756498/imsa-gtp-hybrid-powertrains-daytona-technology/
[5] https://en.wikipedia.org/wiki/IMSA_GTP#Fall_of_GTP
[6] Jones, P. (2023, October 23). Sports Car Demographics: 59 Trends, Facts & Numbers. Motor and Wheels. https://motorandwheels.com/sports-car-demographic-numbers/
[7] EPA. (2023, September 28). Combining Data into Complete Engine ALPHA Maps. U.S. Environmental Protection Agency. https://www.epa.gov/vehicle-and-fuel-emissions-testing/combining-data-complete-engine-alpha-maps
[8] https://lapmeta.com/en/track/variation/31\
[9] https://rennlist.com/forums/997-gt2-gt3-forum/715560-deceleration-g-force-readings.html
[10] Pol Duhr, et all. Time-optimal gearshift and energy management strategies for a hybrid electric race car, Applied Energy, Volume 282, Part A, 2021, 115980, ISSN 0306-2619, https://doi.org/10.1016/j.apenergy.2020.115980.
[11] Oscar P.R. van Vliet, et all ,Techno-economic comparison of series hybrid, plug-in hybrid, fuel cell and regular cars, Journal of Power Sources, Volume 195, Issue 19, 2010, Pages 6570-6585, ISSN 0378-7753, https://doi.org/10.1016/j.jpowsour.2010.04.077.
[12] Yuanjian Zhang, et all, Optimal energy management strategy for parallel plug-in hybrid electric vehicle based on driving behavior analysis and real time traffic information prediction, Mechatronics, Volume 46, 2017, Pages 177-192, ISSN 0957-4158, https://doi.org/10.1016/j.mechatronics.2017.08.008.
[13] Chao Yang, et all, Adaptive real-time optimal energy management strategy based on equivalent factors optimization for plug-in hybrid electric vehicle, Applied Energy, Volume 203, 2017,Pages 883-896, ISSN 0306-2619, https://doi.org/10.1016/j.apenergy.2017.06.106.
[15] Fialka, J. J. (2015). Car Wars: The Rise, the Fall, and the Resurgence of the Electric Car. Thomas Dunne Books/St. Martin’s Press.
Discover more from Engineering Cheat Sheet
Subscribe to get the latest posts sent to your email.


