Why understanding beam bending is important?
What is the importance of beams?
The primary function of beams, regardless of the application, is to act as structural elements that transfer loads. In the civil engineering field, beams refer to horizontal elements which symmetrical sections, such as an i-beam. For example, in a building, beams support the weight of a building’s floors above, ceilings, and roof. They do this by transferring loads to the slab and columns in the building.

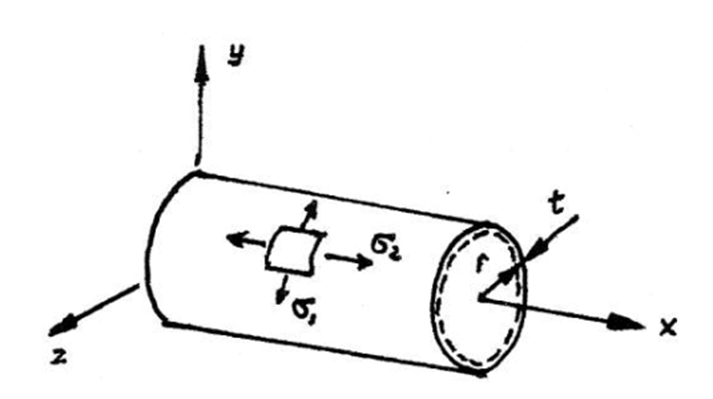
However, in the automotive field beams are thin-walled structures, which make up the body-in-white (BIW). They have relatively large width-to-thickness ratios and are non-symmetrical sections. An example of a beam could be the rocker.

What is the significance of the bending of beams?
Understanding the theory behind beam bending is important because, depending on the application, it might or might not be desirable for a beam to bend. For example, when manufacturing the exhaust of a vehicle, a bending moment is applied to tube stock resulting in internal stresses which force the pipe to change shape. However, if you are designing a bridge, then having an excess of a bending force can cause catastrophic failure.

In both cases, the structural element experiencing the bending moment will be subject to compression and tension. A neutral axis is a theoretical plane, where the beam transition from being in compression to tension or vice-versa and, as a result, is subject to neither compression nor tension.

What is the tube bending method?
Tube bending is a metal-forming process used to create curved or bent shapes in cylindrical tubes or pipes. It involves applying external mechanical forces to the tube to induce plastic deformation, resulting in the desired shape. There are several methods for tube bending, including stretch bending, draw bending, and compression bending. Using internal mandrels, or filling tubes with particulate materials such as sand, prevents the tubes from collapsing during bending. Solid rods and structural shapes are also bent by these techniques. Tube bending is commonly used in industries such as automotive, aerospace, construction, and manufacturing to create a wide range of bent tube components for various applications.

The parameters of a beam bending can be calculated using the equations below. All these equations can be derived using calculus.


What is the beam bending test?
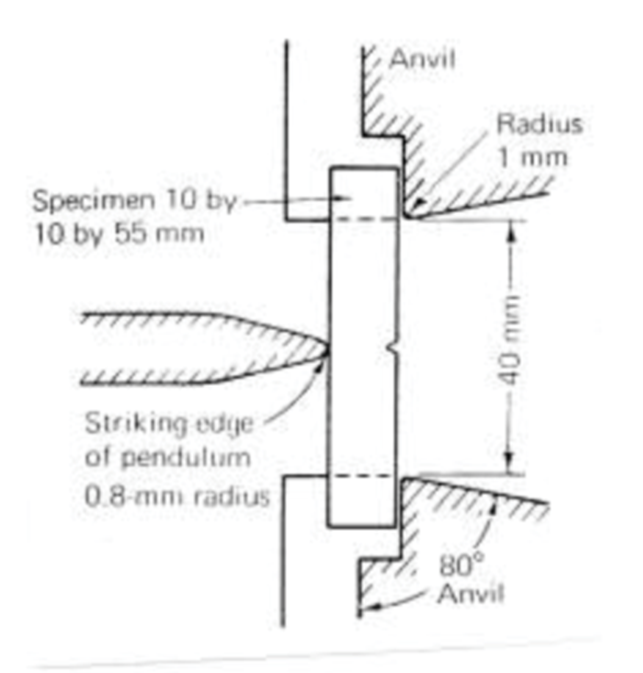
The beam bending test is a test that is conducted by applying a force on a test specimen to bend the material. When conducting a bending test the material can either be simply supported or cantilevered. Regardless of how the test specimen is supported the bending test is used to determine how different materials react when subject to bending moments. A cantilever bending test can also be conducted to understand how the length and the cross-sectional area affect deflection. The goal of conducting this test is to reveal the elastic modulus of bending, flexural and tensile stress, and flexural strain of material.

What is the purpose of a bending test?
The purpose of a beam bending test is to understand how different beams respond to loading. Bending tests are used to determine the tensile strength of materials when the material is too brittle to test using a uniaxial tension test. The most common bending tests include cantilever, 3- and 4-point bending. However, a cantilever bending test is also sometimes used.
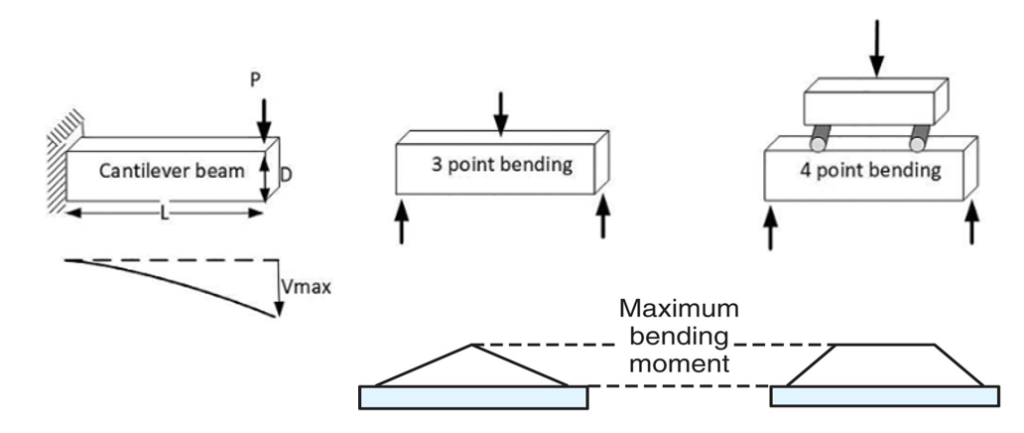
The areas over the beams for the 3-point and 4-point bending test represent the bending-moment diagrams for each respective test. For the 4-point bending test the center region is an area of constant maximum bending moment; by contrast, for the 3-point bending test the maximum bending moment occurs only at the center of the specimen.
What is a real-life example of bending?
A real-world example of beam bending is a clothes hanger that sags under the weight of clothes. This clothes hanger could be modeled as a simply supported beam with a distributed load. Another real-world example that might not be as obvious would be the front motor compartment cross member being subject to aerodynamic loading. The faster you travel in your vehicle the greater the aerodynamic loading will be on the hood of your vehicle. That load will be transferred into your hood latch and as a result into the BIW. The front motor compartment cross member can also be modeled as a simply supported beam with a point load acting in the middle of the section.

How do you perform a beam bending test?
Materials:
- Standard set of different materials and cross-section struts.
- VDAS Hardware and Software
- Load Meter
- Load Meter end
- Knife-edge support
- Loading end with hand wheel
- Loading measuring end
- Deflection Indicator
- Beam weights
- Calipers
Procedures:
- To begin this experiment first set the supports 600mm apart.
- Grab the steel bar 1 (3 x 20 mm), and place it on the support.
- Make sure the deflection indicator is at the center of the beam.
- Place the black knife edge weight hanger (how the load will be applied to the beam) on the beam
- Place the weight hook (10g) on the black knife-edge weight hanger.
- Begin by applying 100g on the hanger using beam weights and increase to 600g in increments of 100g.
- Make sure to record the deflection at each interval.
- Repeat steps 2-7 with the brass and aluminum bars
- For the second part of the experiment, you will once again you steel bar 1 but you vary the length from 300 mm to 600mm in increments of 100mm.
- Before applying any load makes sure to reset the deflection indicator and that the knife-edge weight hanger is once again located at the center of the beam for each trial.
- During each interval apply a load of 200g to the center of the beam and record the deflection.
- For the final part of this experiment, we will be varying the cross-sectional area. To begin set the length to 500mm
- Now place bar 1 (3 x 20 mm) on the supports.
- Place the knife-edge weight hanger at the center of the beam with the deflection indicator.
- Zero out the deflection indicator.
- Place 200g on the weight hanger and record the deflection.
- Repeat steps 12-16 with bar 9 (4 x15 mm) and bars 10 (5 x 10 mm).
Equations/Givens
Equations:
% error:

Force:

Area:

Theoretical Deflection:

Moment of Interia:

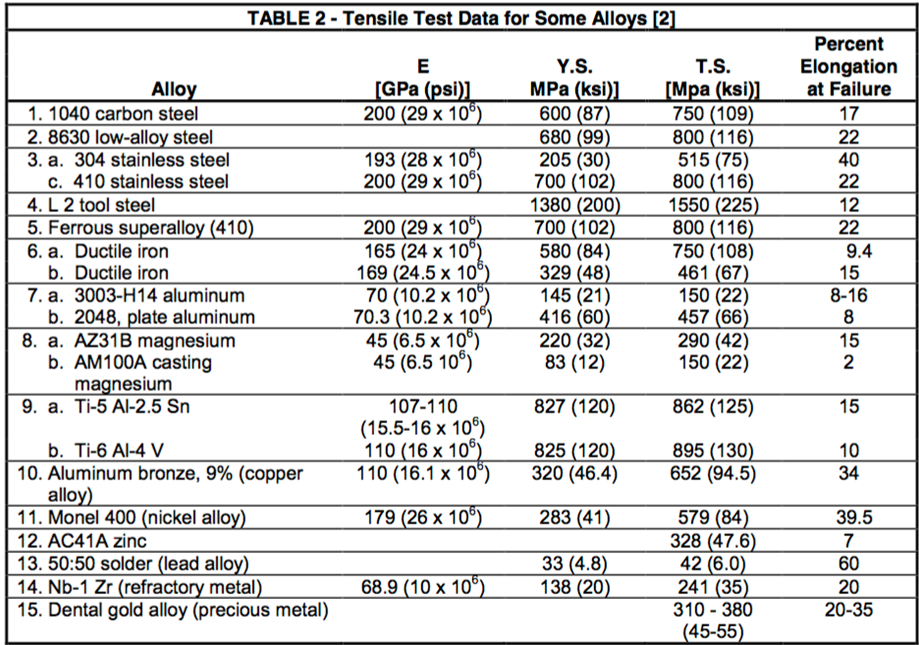
Published data charts:

Sample Calculations:
Force:

Moment of Interia:

Theoretical Deflection:

% error:

Graphs:
Data sets:


Findings
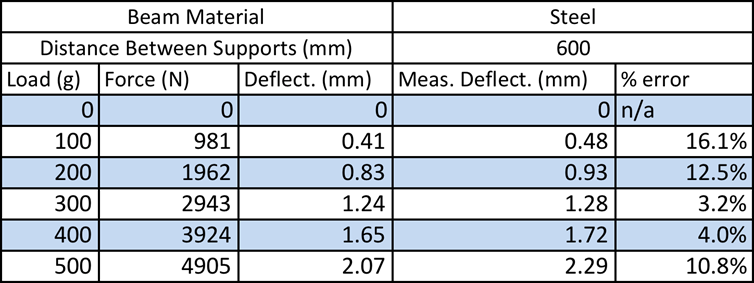
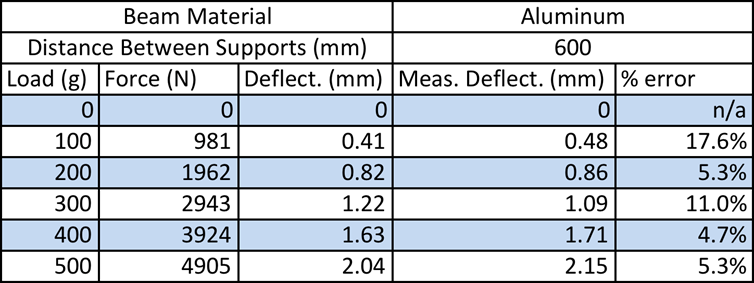
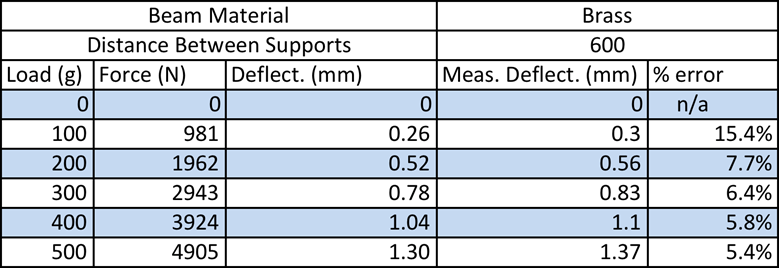
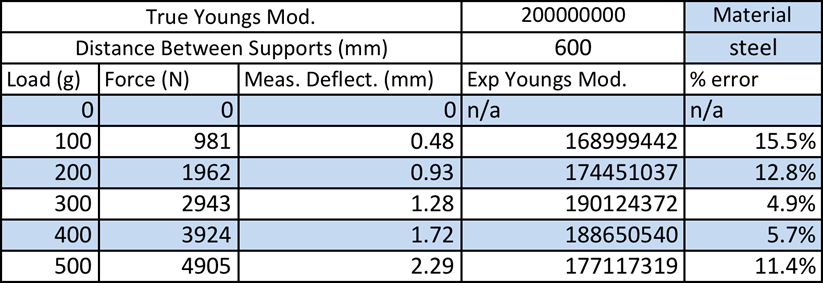
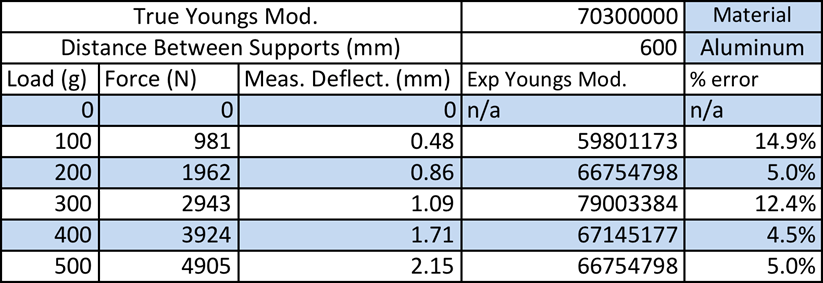
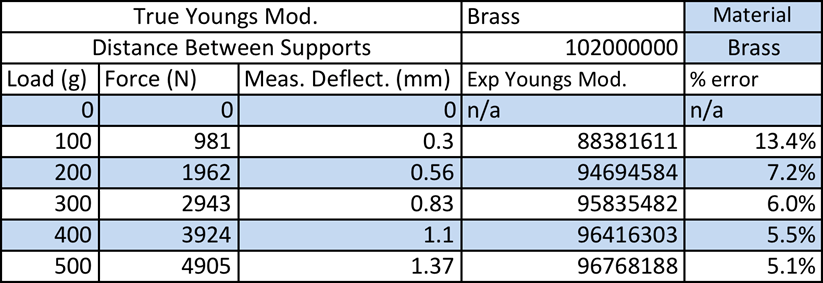
After conducting this experiment and evaluating the experimental data I am very pleased with the way everything turned out. Many different variables were evaluated and all and all no value had a greater % error than 20%. For the first part of this experiment where other material beams were tested at different loads, the results were as follows. For steel, the % error ranged from 4-16.1% error. For aluminum, the % error ranged from 4.7-17.6% error. Finally, for brass, the % error ranged from 5.4-15.6% error. There was no real pattern with any of the % errors that were calculated. Based on this I believe that to reduce the % error more trials could have been conducted. Or it is known that the cross-section is not exactly the same though out the whole beam so possibly the cross-section could have been measured at 3 different points and then averaged together.
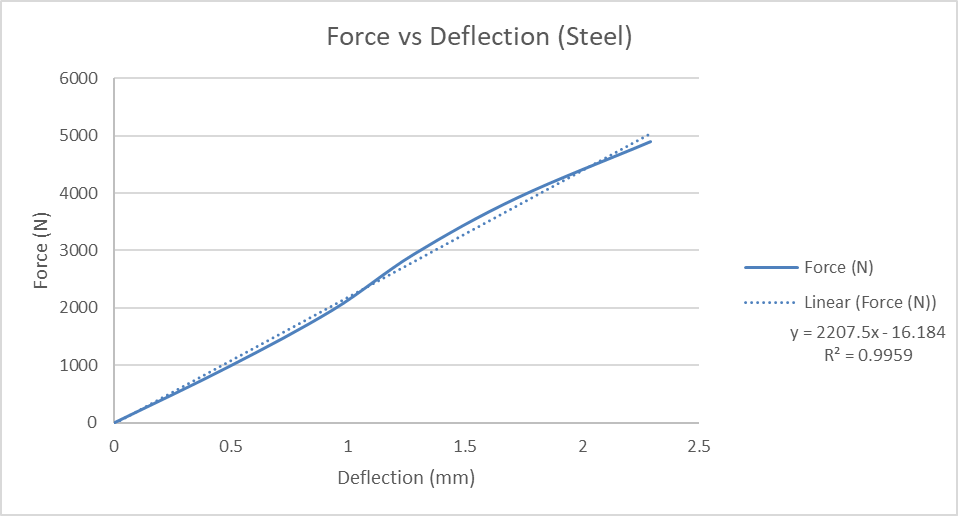
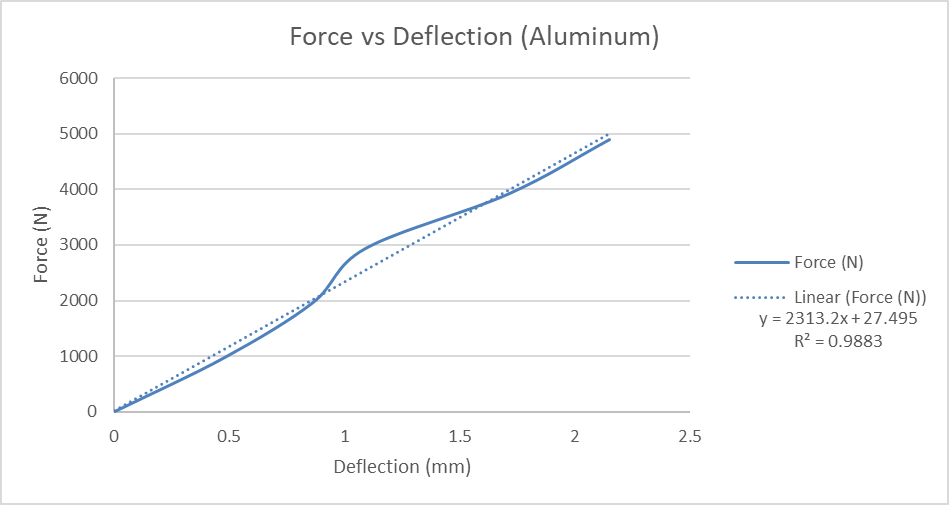
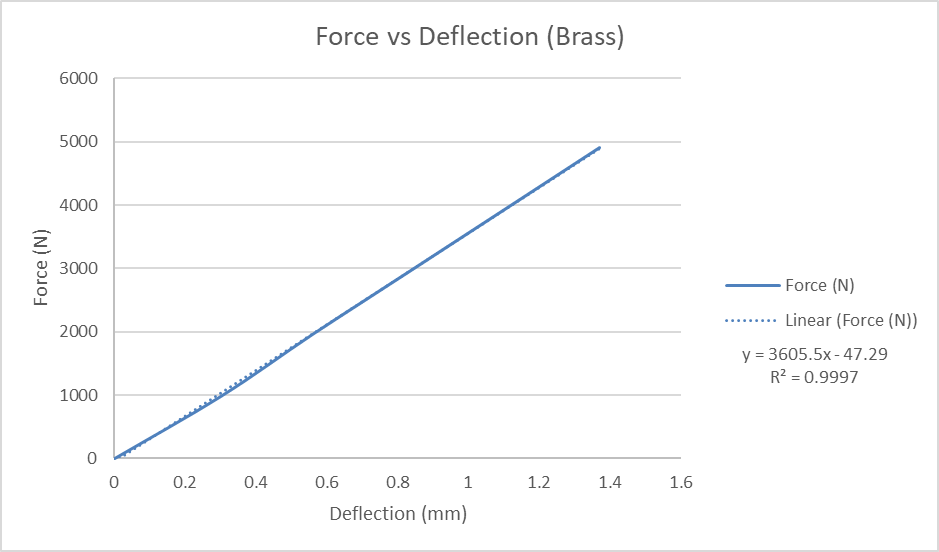
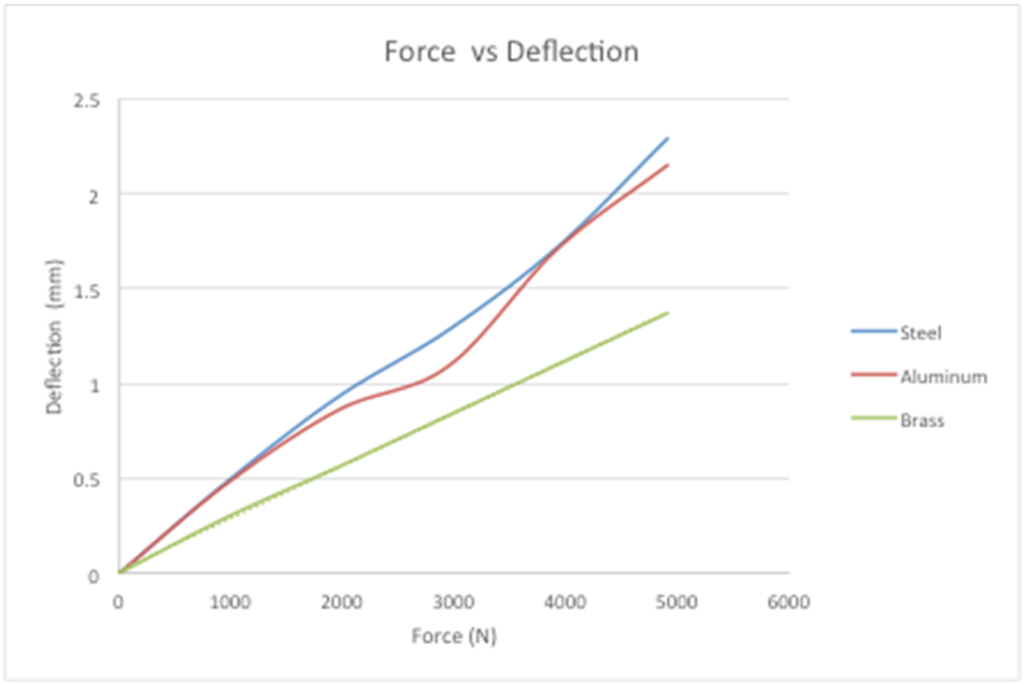
The data acquired during the first part was plotted load vs deformation. What this relived was that his experiment could be numerically represented. All three graphs were modeled as linear functions and R2 values were calculated to find and show the correlation between the actual data and the theoretical model. The result was that the R2 value was very close to 1 signifying a very good correlation. This data makes sense because as the load is increased it is expected for the deformation in the center of the beam to also increase.
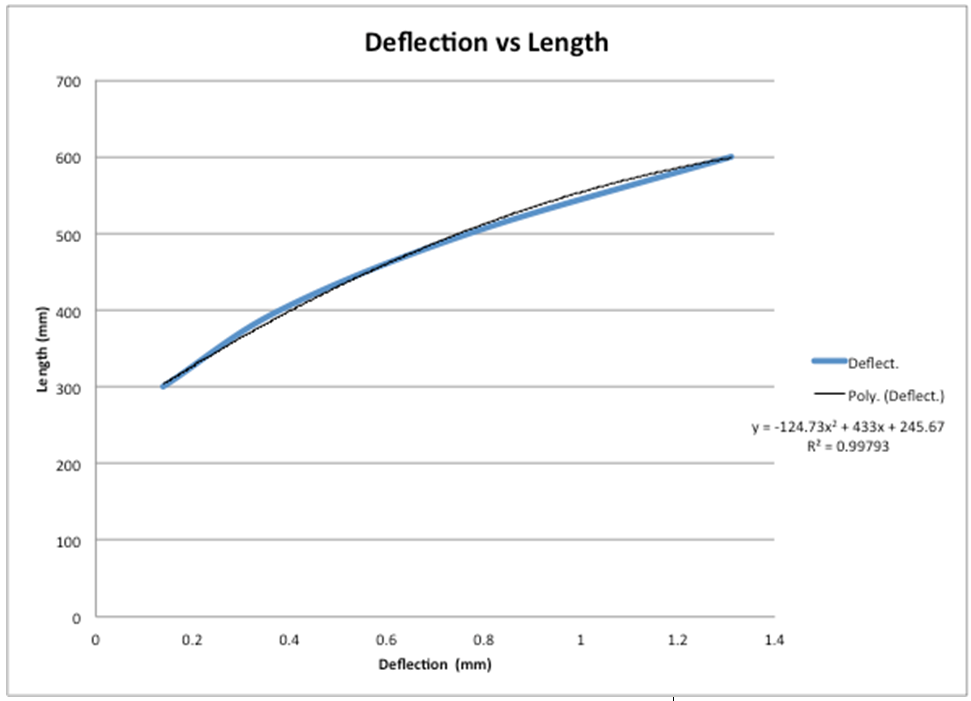
For the second part of this experiment, the length of the steel beam was varied from 300mm – 600mm. the results from this test just like the first part were good. The % error ranged from 5.4% error to 9.3% error which all in all is low. Just as before I believe that if additional trials were done the accuracy of the results could have been reduced.
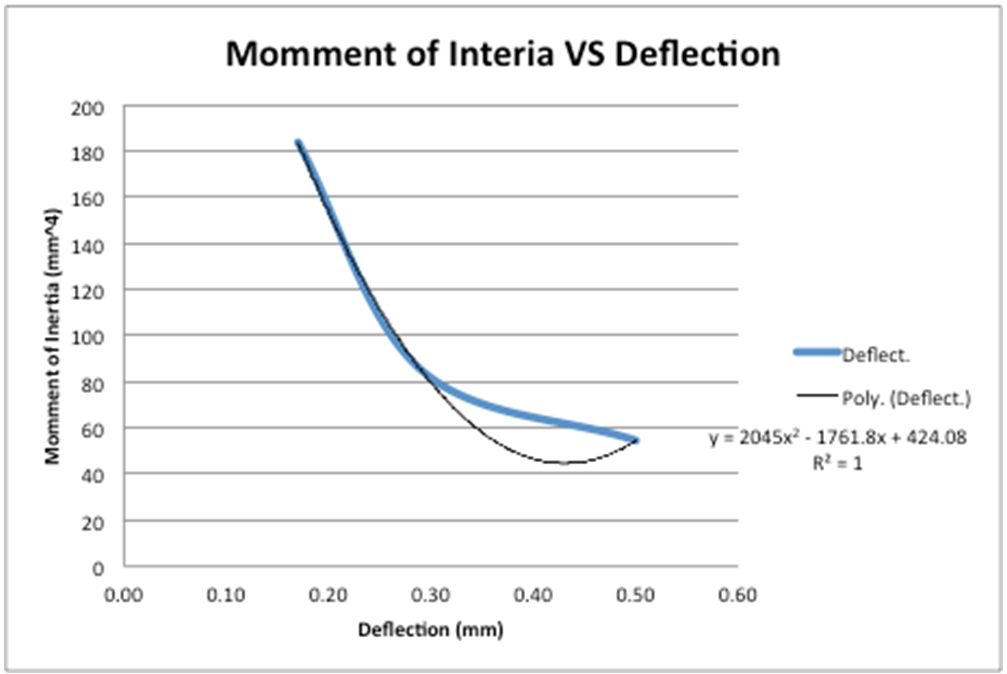
For the final part of this experiment, the cross-sectional area of the beam was changed thus changing the polar moment of the internal of the beam being used. From this part of the experiment, the results for beam 9 were not as good and low as the rest of the beams and stand out as a clear outlier. The overall % error for this part of the experiment ranged from 3.4-22.2% error. As stated before where beam 9 is the outlier. I believe the error in this part of the experiment is mostly due to measurement error. Additional measurements of the cross-section of beam 9 to verify the dimensions were correct and average out the cross-sectional area for the whole beam I believe would have reduced this error and resulted in better results for this particular trial.
This data was also plotted to demonstrate how the change in the cross-sectional area would affect the overall deformation. What was found was that this data could be represented as a polynomial function to the second degree and get a perfect correlation between the data and model, with an R2 value of 1. As expected as the cross-sectional area is increased the deformation of the beam decreases. I believe even though the graph and the trend line of the model do not overlap the reason that such a good correlation was found was that this test was only done with 3 different cross-sectional beams. To get better results more beams should be tested and that way the validity of this polynomial function to represent this experiment can be tested.
References
- Experiment #7 Beam Bending, Mechanical Measurements, Laboratory Procedure, Department of Mechanical Engineering Widener University
- Modulus of Elasticity or Young’s Modulus – and Tensile Modulus for common Materials, Engineering ToolBox, http://www.engineeringtoolbox.com/young-modulus-d_417.html
- Hiyam Farhat, Chapter 3 – Materials and coating technologies, Editor(s): Hiyam Farhat, Operation, Maintenance, and Repair of Land-Based Gas Turbines, Elsevier, 2021, Pages 63-87, ISBN 9780128218341, https://doi.org/10.1016/B978-0-12-821834-1.00007-1 (https://www.sciencedirect.com/science/article/pii/B9780128218341000071)

