Synthesis of a Copper Coordination Compound & Solubility
The purpose of this experiment is to prepare a coordination compound of a transition metal, calculate the % yield and then determine the solubility of this compound and solve for Ksp. After conducting this experiment the calculated % yield was 38.2%. The claim is that the experimental Ksp for this compound was 0.0112. For experiment 7 the balanced chemical equation used is stated below:
CuSO4*5H2O(aq) + 2K2C2O4*H2O(aq) ⇆ 2K2[Cu(C2O4)2](s) + K2SO4 (aq) + 5H2O(l)
To conduct this part of the experiment Copper (II) sulfate pentahydrate was mixed with Potassium oxalate monohydrate. When both of these aqueous solutions were mixed at first the solution turned cloudy white, afterwards the product turned into a light opaque blue. After this solution was placed in an ice bath you started to notice that there was separation the aqueous solution where at the bottom of the test tube you got accumulation of light blue crystals at the bottom. The changes and color and the fact that you started to have a precipitant form were indications that the reaction had occurred. The theoretical yield was 4.62 g of product where in fact only 1.765 g were recovered leaving the % yield very low at only 38.2 % yield. See Table 1: Synthesis of a Copper Coordination Compound below.
| Mass Copper(II) sulfate pentahydrate | Mass Potassium oxalate monohydrate | Moles Cu(II) | Moles Oxalate | Mass Product | Theoretical Yield | Percent Yield | |
| Name | g | g | mol | mol | g | g | % |
| Jake | 2.11 | 3.089 | 0.00845 | 0.01677 | 2.755 | 4.862 | 56.7% |
| Anthony | 2.005 | 2.984 | 0.00803 | 0.01620 | 1.765 | 4.620 | 38.2% |
| Kate | 2.093 | 3.043 | 0.00838 | 0.01652 | 2.752 | 4.823 | 57.1% |
Some of the factors that could have led to such a low % yield could have been that I removed my filter paper when transferring the solid to the dish to let it dry overnight. Of course it was impossible to completely remove the entire solid and some was tossed out with my filter paper. Also when using the Buchner funnel I did notice that the solid which was no longer on the filter paper after it was washed, as a result some of the solid was suctioned away.
The second part of this experiment required to test the solubility of the solution. The Ksp expression for this reaction is Ksp = [ K2[Cu(C2O4)2][K2SO4]. See Table 2: absorption spectrum to see full absorption spectrum for Copper (II) Sulfate.
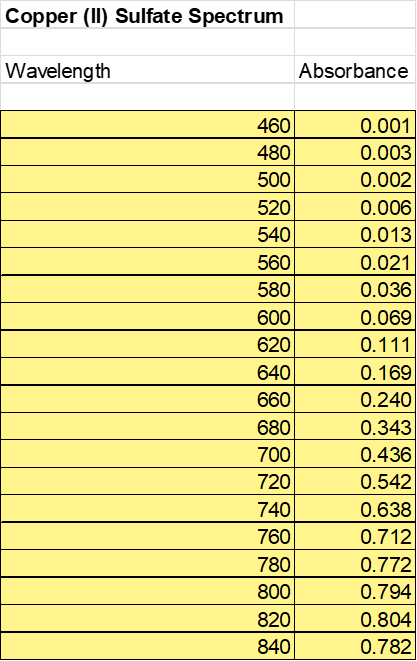
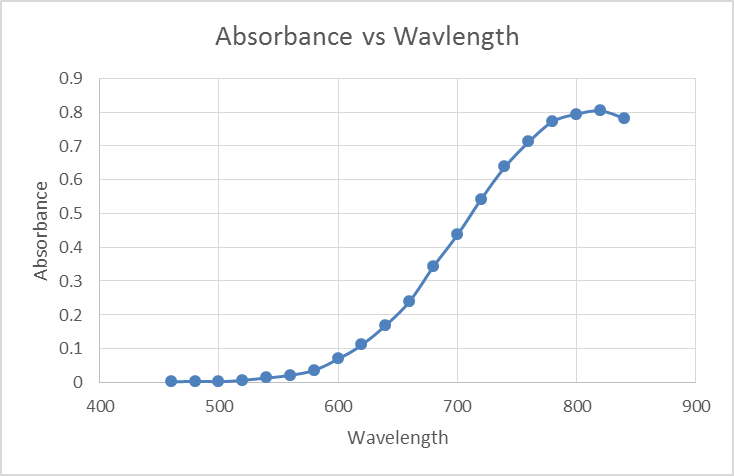
Based off the values recorded above the absorbance of the Copper (II) Sulfate was plotted against the wave length. See Figure 1: Absorbance vs Wavelength Copper (II) Sulfate at the top of the following page. What is observed by plotting this data is a logistics curve where at the beginning of the graph you notice exponential growth and at the end you notice exponential decay.
The following step required to take the absorbance measurements but at different concentrations. See Table 3: Absorbance with varying concentrations.
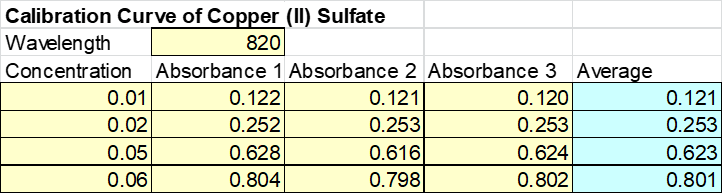
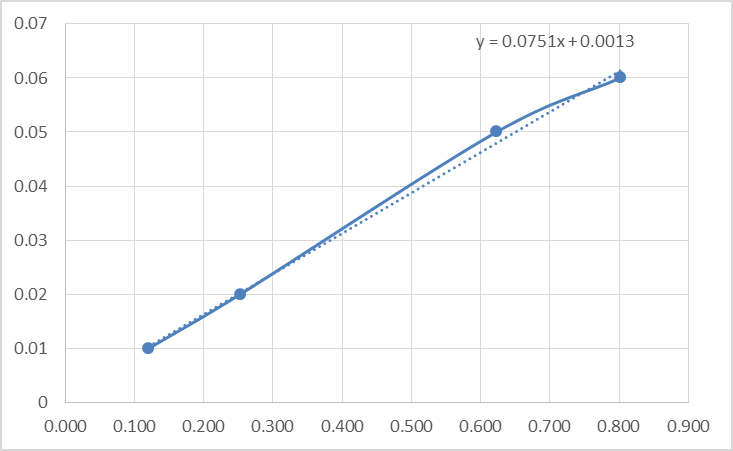
The data acquired from Table 3 was then used to make Figure 2: Absorbance with varying concentrations. After plotting this data a linear relationship is observed between the concentration and the absorbance. See Figure 2 at the top of the following page.
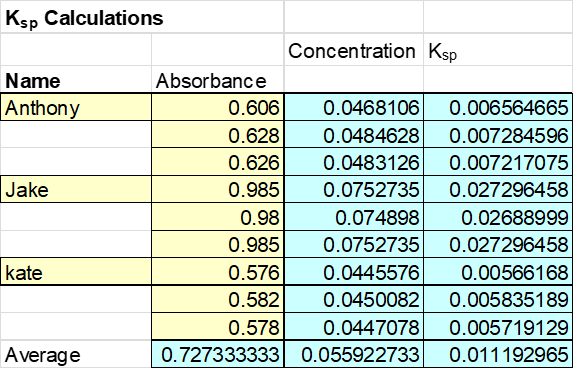
Finally the absorbance of our individual samples were then tested and recorded below. The data was collected from whole group and the average absorbance was calculated at 0.727 with a Ksp value of 0.0112. Based on this number the concentration of the sample can be found to be about 0.055M. See Table 4: Experimental Ksp .
Reference: